Latest Version: 4.11.0 - Released: 11/14/2024
Quick CPU is a program that was designed to fine-tune and monitor important CPU and System parameters such as CPU Temperature (Package and Core Temp), CPU Performance, Power, Voltage, Current, Core Parking, Frequency Scaling, System Memory, Turbo Boost, C-States, Speed Shift FIVR Control as well as making other adjustments. Below you can find information about the way this application works and how to interpret application data and settings as well as modify and monitor other critical system parameters.
In the past, most computers were desktop machines designed primarily for delivering the best possible performance, with little consideration for technologies such as SpeedStep or Turbo Boost etc.
However, in today's world, power consumption sometimes outweighs performance concerns. With significant advancements in technology and evolving hardware expectations, CPUs now incorporate a variety of features such as TurboBoost, SpeedStep, Hyper-Threading, and individual core states to reduce power consumption and heat generation. While these advancements are generally positive, they can occasionally result in situations where end-users do not experience optimal performance when needed (referred to as delayed performance boosts). This can be attributed to numerous difficult-to-predict factors, including system state, CPU state, heat levels, and more. This application aims to help control such factors and minimize the impact of performance degradation whenever possible. Further details on many of the features mentioned above will be provided in the following description. If you are interested, please continue reading
If your system has Intel CPU code name Skylake or greater with HWP (Intel Speed Shift) enabled by default, please follow the link below to find out more about the performance adjustment details and differences Performance adjustment on HWP (Intel Speed Shift) enabled systems
CPU Core parking is a feature that was introduced in Windows Server 2008 R2. The processor power management (PPM) engine and the scheduler work together to dynamically adjust the number of cores that are available to run threads. The PPM engine chooses a minimum number of cores for the threads that will be scheduled. Cores that are parked generally do not have any threads scheduled, and they will drop into very low power states when they are not processing interrupts, DPCs, or other strictly affinitized work. The remaining cores are responsible for the remainder of the workload. Core parking can potentially increase energy efficiency during lower usage.
The problem with Windows way of core parking is lack of flexibility, since by default you are given very few options for setting Core parking index on your machine
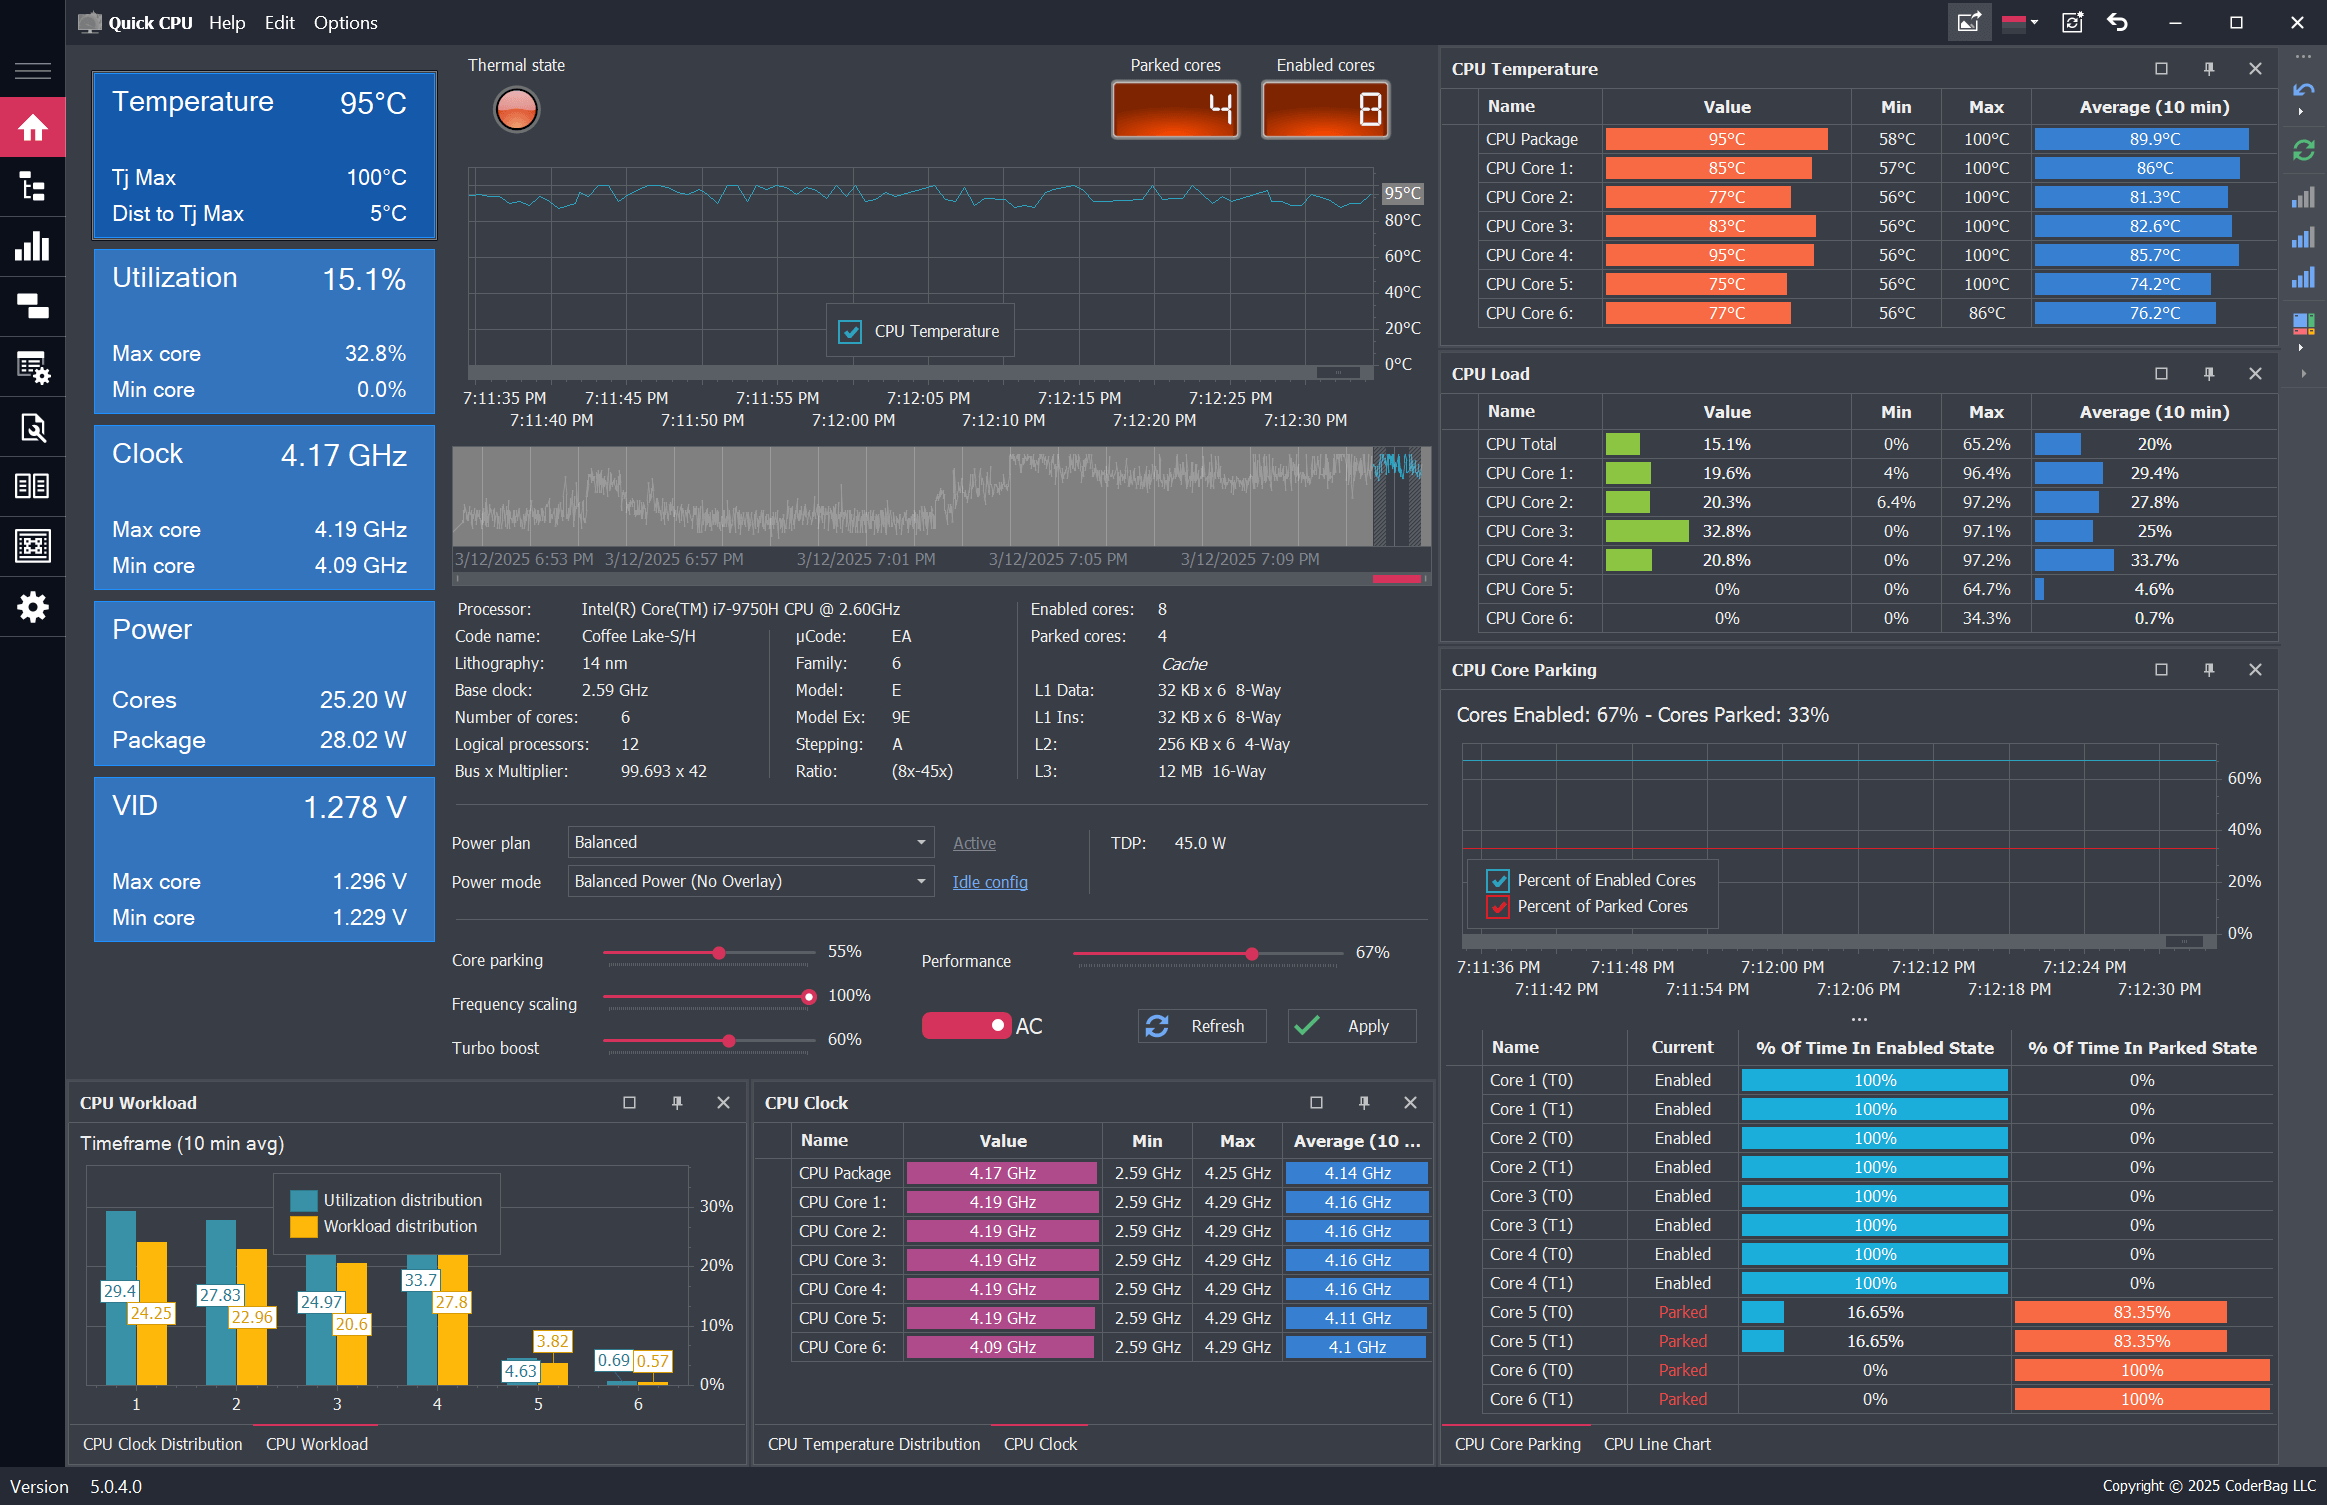
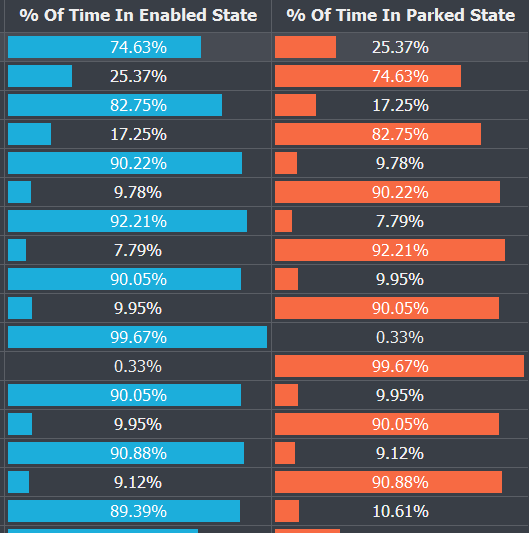
The functionality of this application allows you to control the activation or deactivation of CPU cores based on your personal requirements. Alternatively, you can choose to enable all cores continuously, as explained below. Moreover, you can now determine the status of specific cores by examining the CPU graph. Additionally, real-time information regarding enabled and parked cores is accessible in the CPU performance tab under 'Enabled cores' and 'Parked cores'. This information is continuously updated, eliminating the need to manually refresh to ascertain the current status.
Here's an example of how core parking actually works and the meaning of an index number:
Let's consider a CPU with a total of 6 cores (including logical cores), which represents 100% of our CPU power. Each core contributes approximately 17% of the total (100 / 6 = 16.6 ~ 17). For instance, suppose we want to ensure that 4 out of the 6 cores are never parked by the operating system (OS) regardless of the load. In this scenario, we set the threshold to 68% (17 * 4 = 68). This instructs the OS to park only 2 out of the 6 cores. If we set the threshold to 100%, we essentially inform the OS that none of our CPU cores should be parked, and they should operate continuously at full performance (refer to the pictures below). Conversely, setting the threshold to 0% or close to it allows the OS to park any number of cores (remember to press the "Apply" button after adjusting the threshold).
CPU frequency scaling is a feature that enables the operating system to adjust the CPU frequency dynamically, aiming to match the processing power with the system's demands. This means the CPU performance is boosted when necessary or throttled to save energy when possible. Similar to Core Parking, the operating system dynamically scales the CPU frequency based on the system load. The control index for CPU frequency scaling operates similarly to Core Parking.
An important detail about frequency scaling is that even if you set the index to 100%, it will increase (and maintain) the frequency up to the CPU's base frequency level. However, it still utilizes dynamic scaling for any additional performance beyond the base frequency.
Basically Frequency scaling is a feature that controls how your computer's CPU adjusts its speed in response to different tasks. When your computer handles demanding tasks, it can temporarily increase its speed beyond the base frequency, a capability enhanced by perf boost technologies from Intel and AMD.
During normal system operation, the CPU in your system operates at a standard clock speed, indicating its overall performance. However, when heavy processing tasks are encountered, Turbo Boost comes into play, temporarily increasing the CPU clock frequency to handle the workload efficiently. By setting the TurboBoost index to its maximum value, the CPU strives to deliver performance exceeding the level corresponding to the processor's base frequency consistently.
Intel Turbo Boost and AMD Precision Boost (Turbo CORE on earlier versions) technologies are features designed to enhance processor performance when it's most needed, particularly during high system loads. Essentially, they dynamically increase the CPU operating frequency, thereby boosting performance in a non-deterministic manner
Intel Turbo Boost and AMD Precision Boost (Turbo CORE on earlier versions) technologies are features that allow processors to achieve additional performance when it is most useful (that is, at high system loads). Basically it raises CPU operating frequency (as well as performance) in a dynamic (non deterministic) way.
Here’s what Intel states about their turbo boost technology:
Intel® Turbo Boost Technology 2.01 accelerates processor and graphics performance for peak loads, automatically allowing processor cores to run faster than the rated operating frequency if they’re operating below power, current, and temperature specification limits. Whether the processor enters into Intel® Turbo Boost Technology 2.0 and the amount of time the processor spends in that state depends on the workload and operating environment.
The Performance index is an operating system feature that enables an end user to specify how much processor should favor energy savings over maximum performance. This feature was introduced in Windows 10 OS and is not available on earlier versions.
Power Mode settings (Overlays) allow you to adjust how your system manages energy consumption and performance. You can choose from various modes such as Best battery life, Balanced, Max performance. These settings dynamically alter your system's behavior to either extend battery life, balance between performance and energy efficiency, or maximize performance depending on your current needs.
When Power Mode Control is Disabled
The combo box for selecting Power Mode is disabled (grayed out) in the following scenarios:
Power Mode Selection is Reset to Balanced
If a selected power plan does not support Power Mode Overlays adjustments, the Power Mode setting will automatically reset to Balanced or no Overlay
Processor C-states represent idle power-saving states. During all C-states (except C0), the processor remains idle, meaning no instructions are being executed. C0 can be considered an idle power state where the core is actively executing instructions.
Each core has several idle states, such as C0, C1, C3, etc.
After all hardware threads supported by a core have executed the HALT instruction (which halts the CPU/unit until the next external interrupt is fired), the core transitions to the first non-idle state, C1. Once the core is in C1, the coprocessor's power management routine (distinct from the OS power manager) needs to determine whether it's beneficial to further shut down the core and transition it to the next C-state. In such cases, additional parts of the core are shut down, and power is gated.
On the images below (see aplication footer) you can observe the percentage of time CPU spends in the specific C-State supported by the CPU.
C-State | Description |
---|---|
C0 | At least one hardware thread within the core is executing some task. In this state core stays active. |
C1 | All four hardware threads within the core finish their tasks. They all execute HALT instruction. At this point the core is clock-gated |
C2 | Can also be considered as a transition state. Core clock is gated, Interrupts are not served. |
C3 | Sometimes referred as a sleep state. In this state the processor might not be keeping its cache coherent, internal clock is off |
C6 and up | Deep power down state |
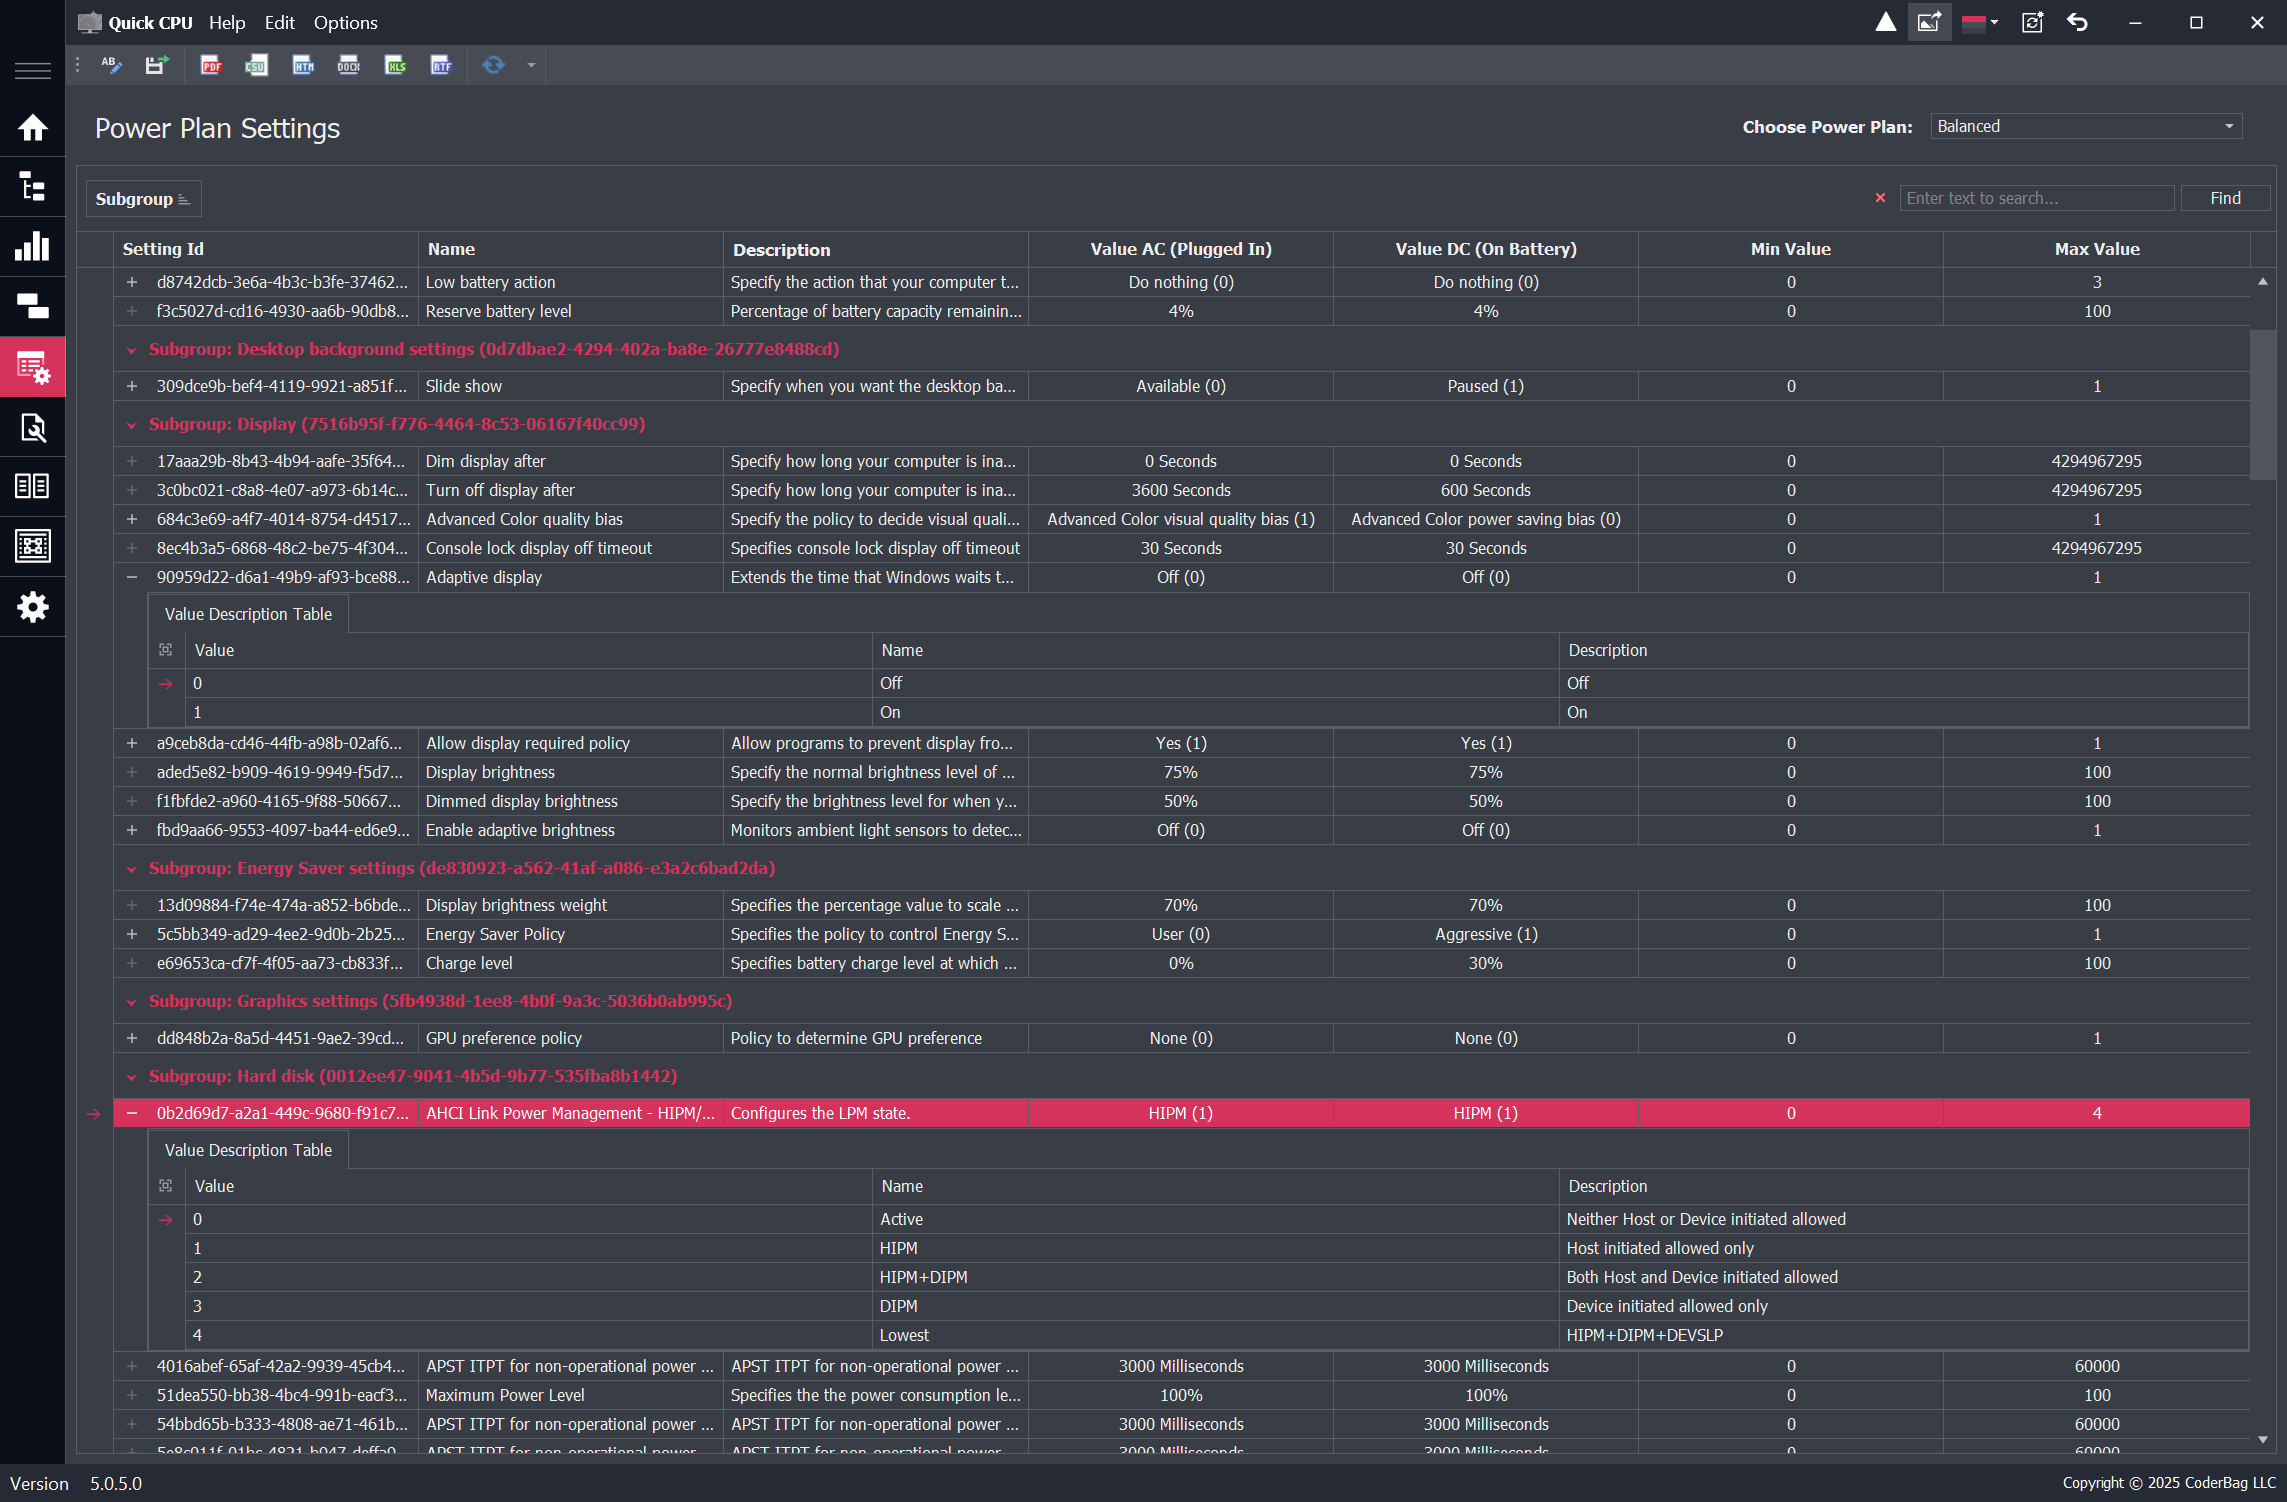
The following section will provide a short summary of features and functionality related to the Power Plan Management application form.
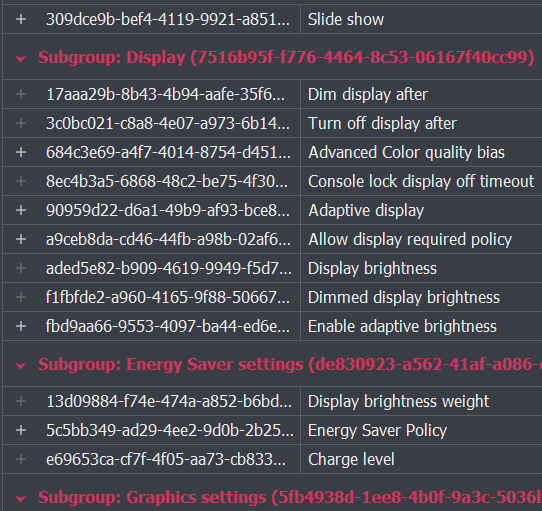
Power Plan Management consists of two main sections:Power Plan Settings Settings: this section lists all the settings that can be found in the selected power plan and provides the following features:
Power Plan Management this section allows an end user to view and manage system power plans available on the computer, and provides the following features:
For more information about Power Plan Management features please visit the following page: Windows Power Plan Management
Remember that all of these settings are not OS settings and will be stored directly on your CPU hardware registers. With that being said, make sure you know what you are doing and proceed with caution.
For more information about all the features please visit the following pages:
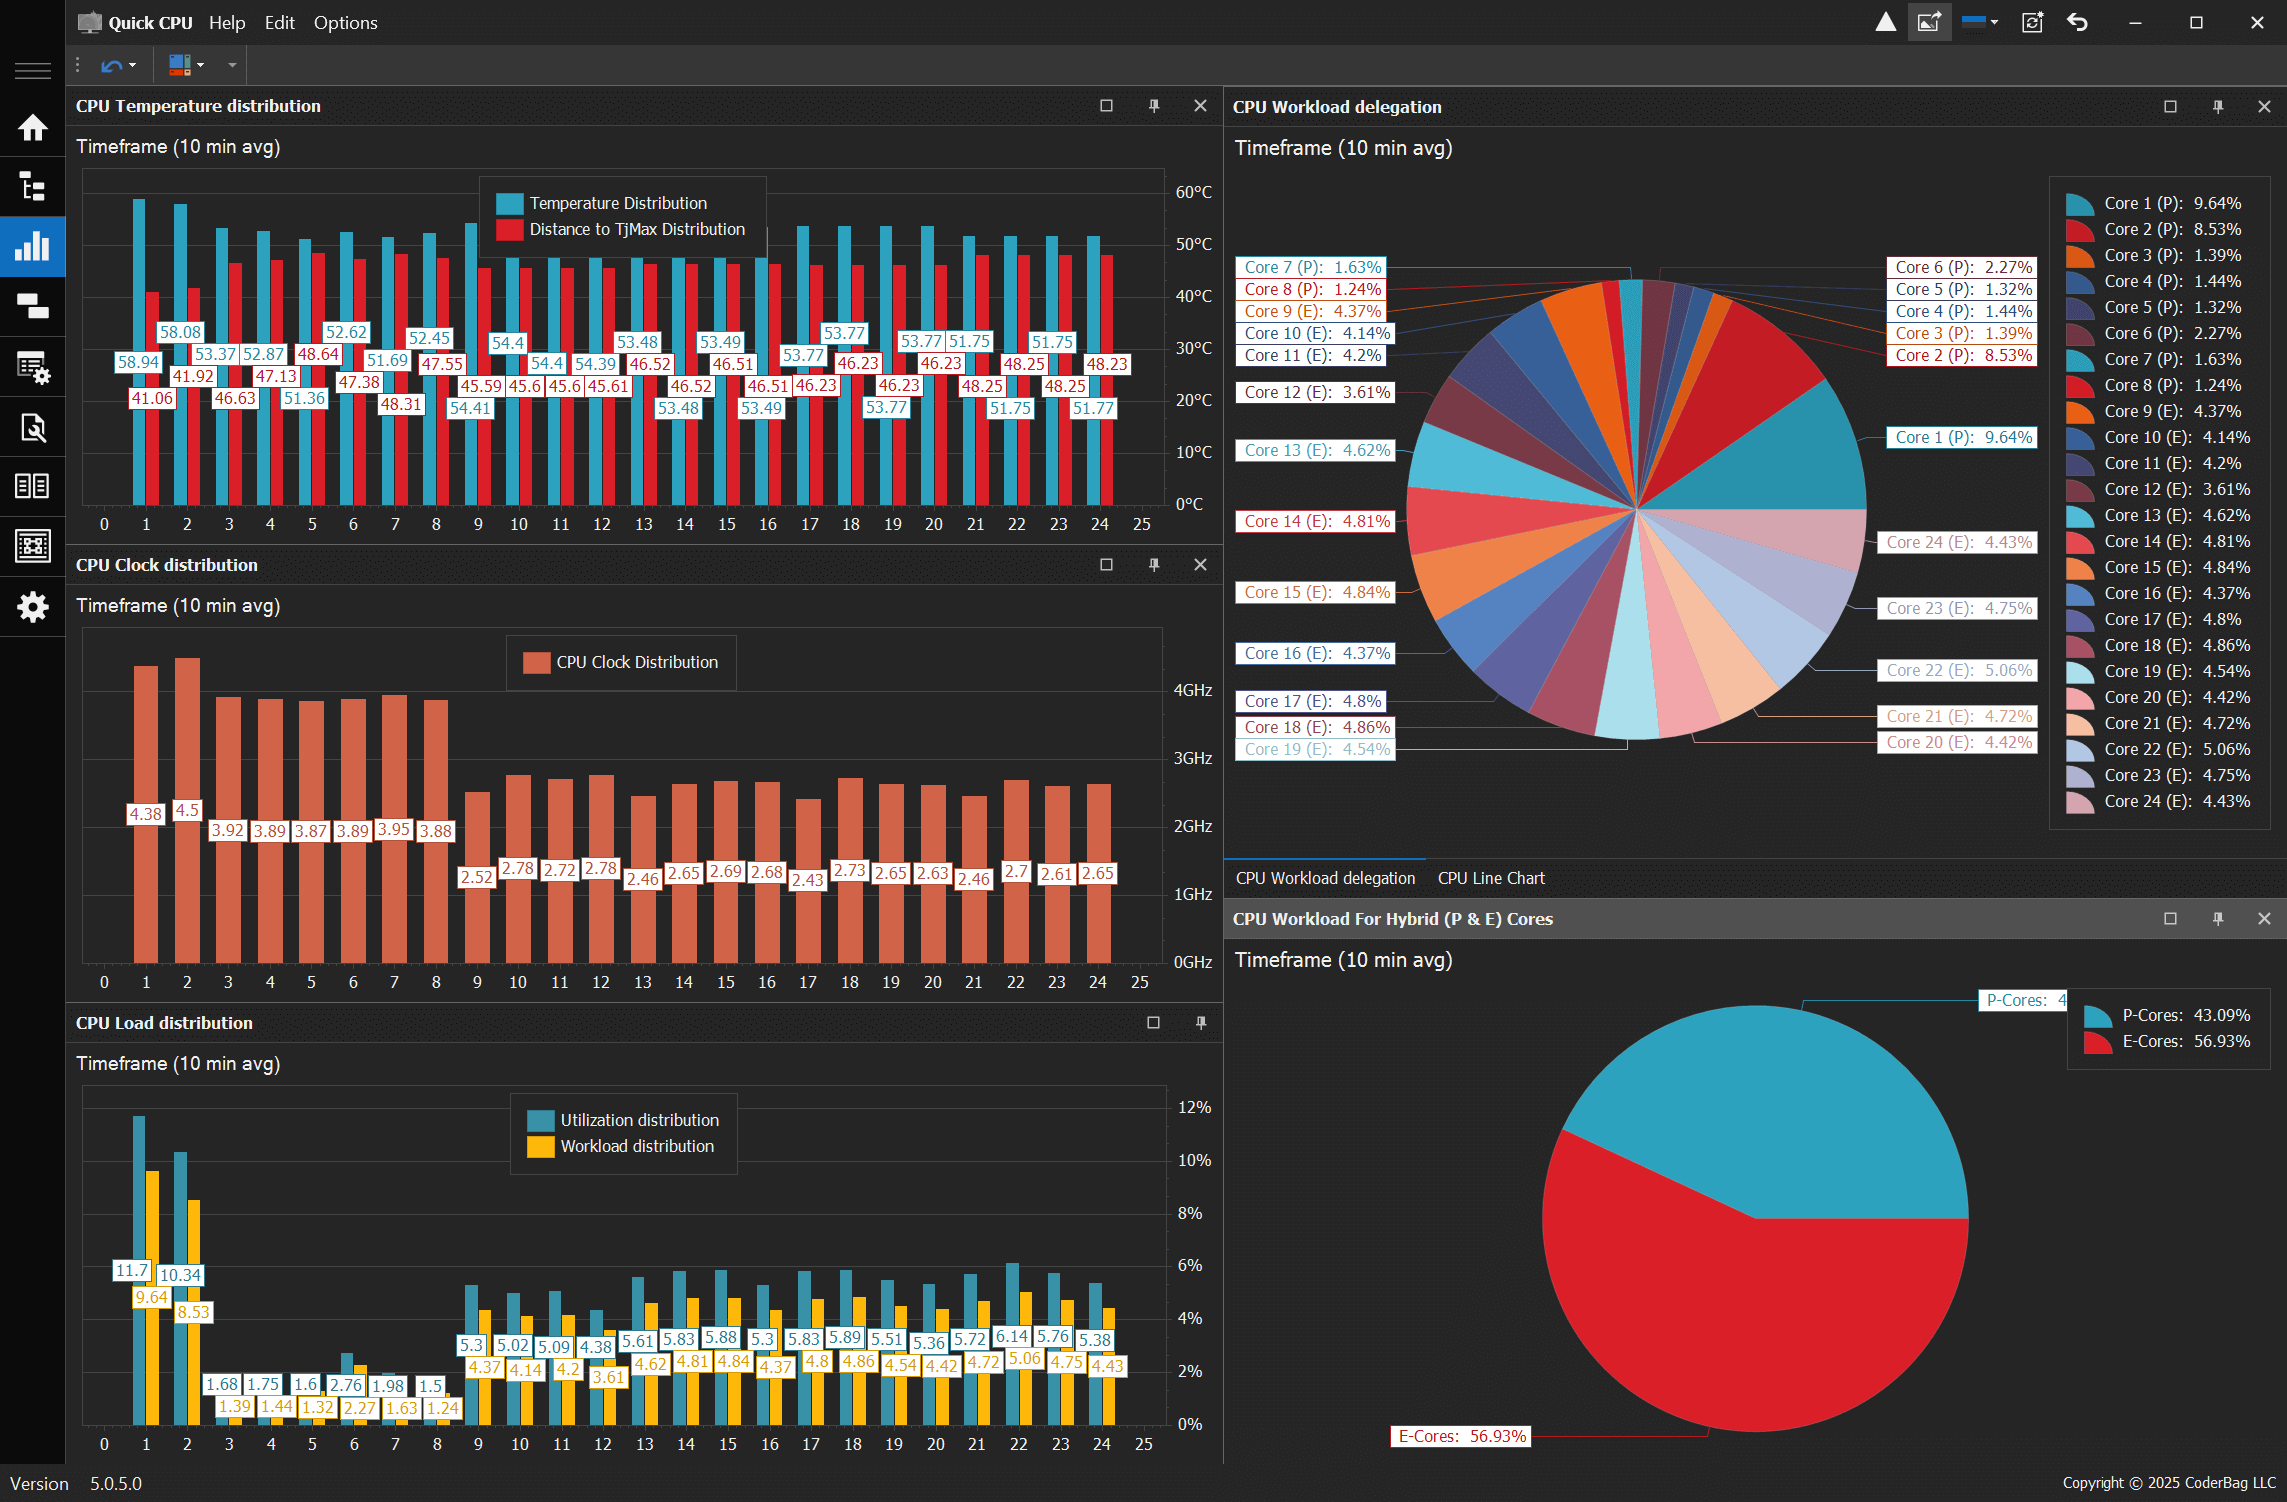
The Quick CPU application features several chart controls located on the right sides of the interface. These charts are organized into different panels based on their functionality. It's worth noting that all panels used for the application's charts are DOCKABLE. This means they can be rearranged, hidden, docked, undocked, floated, or hidden according to the user's preferences.
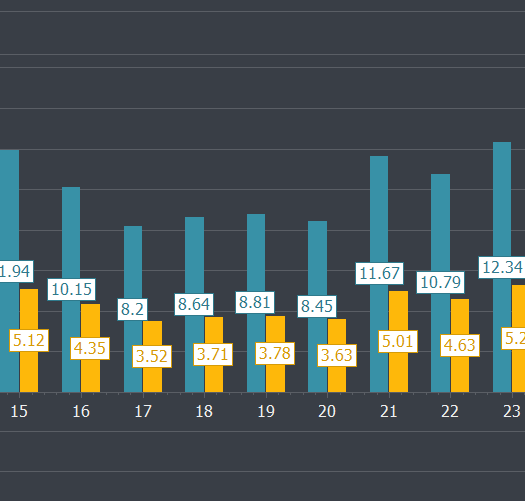
This chart control shows data for four different CPU indicators:
The charts listed above have the following options:
NOTE: that in order to see real time chart data, the chart scroll bar has to be moved to the very right position. When the scroll bar is located elsewhere (center position for example) the application will assume that you are accessing historical chart data.
This panel has several different charts. The visibility of each chart will depend on the CPU type.
This panel contains a CPU Workload Delegation chart, which displays the average workload for each CPU core over a configurable time frame window. By default, this window is set to 5 minutes (or less if the application has been running for less than 5 minutes). Using this chart, users can observe how the workload is distributed among different CPU cores by the operating system. It's important to note that this chart differs from the Load Distribution chart. While the Load Distribution chart shows the average core utilization (indicating what percentage of the total core processing capacity has been utilized), the CPU Workload Delegation chart illustrates the percentage of workload delegated to each CPU core by the operating system.
For more information about Application Charts and Chart Options please visit the following page: Application Charts and Chart Settings
Starting from version 4.0.0.0 some of the application functionality will be implemented using dockable panels. This feature will add more flexibility and viewing options to an end user. Each panel can be individually rearranged, hidden, visible, docked, auto-hidden or completely undocked from it’s parent form. By using a mouse an end user can drag each panel to a chosen position within the dockable area which will be highlighted by the application. Each panel has a set of controls on the top, similar to a normal window these controls can be used to close, dock/undock or auto hide the panel. Once the layout for one or more panels has been modified it will be saved on the application exit and restored back on application start, this option can be enabled or disabled by checking the following item: Panel menu -> Save panel layout on application exit. The original panel layout can be restored at any time by clicking on the Reset panel layout menu item under Panel menu. An end user can use a Panel visibility menu item under the Panel menu to view or set visibility options for each individual panel.
System tray notification dialog can be configured by going to: Options menu -> System tray notification settings
Heterogeneous Power Plan settings can be used to provide guidance to the Windows scheduler and core parking subsystems regarding thread scheduling and core parking preferences in systems with Hybrid Core Architecture, featuring at least to different types of cores Performant (P) and Efficiency (E) cores. Quick CPU offers quick access to these settings from the main application form. These settings are also accessible via Quick CPU's dedicated Power Plan management interface. Read more ..
Current version 4.11.0.0
Release date: 11/14/2024
Compiled for: .NET 4.6.1
Tested on platforms: Win7 x64-en SP 1, Win8 x64-en, Win8.1 x64-en, Win10 x64-en, Win11 x64-en
Send your suggestions to: [email protected]
Your support is extremely important to us. It helps us to continue developing and improving the application and providing you with the best possible experience. Your contribution helps us to dedicate more time and resources to adding new features, improving performance, and providing the best possible support for our users. In addition, your support will enable us to provide personalized and responsive assistance to our users, helping you to get the most out of our application. Your donation will go a long way!
CoderBag Team.
Release version | Release date | Download | Release notes |
---|---|---|---|
4.11.0.0 | Nov 14, 2024 | Download version 4.11.0.0 (64 bit) - (32 bit) | View release notes |
4.10.0.0 | May 17, 2024 | Download version 4.10.0.0 (64 bit) - (32 bit) | View release notes |
4.9.0.0 | Feb 23, 2024 | Download version 4.9.0.0 (64 bit) - (32 bit) | View release notes |
4.8.0.0 | Nov 3, 2023 | Download version 4.8.0.0 (64 bit) - (32 bit) | View release notes |
4.7.0.0 | July 19, 2023 | Download version 4.7.0.0 (64 bit) - (32 bit) | View release notes |
4.6.0.0 | June 21, 2023 | Download version 4.6.0.0 (64 bit) - (32 bit) | View release notes |
4.5.3.0 | Feb 20, 2023 | Download version 4.5.3.0 (64 bit) - (32 bit) | View release notes |
4.5.2.0 | Jan 2, 2023 | Download version 4.5.2.0 (64 bit) - (32 bit) | View release notes |
4.5.1.0 | Nov 25, 2022 | Download version 4.5.1.0 (64 bit) - (32 bit) | View release notes |
4.5.0.0 | Nov 16, 2022 | Download version 4.5.0.0 (64 bit) - (32 bit) | View release notes |
4.4.2.0 | Sept 17, 2022 | Download version 4.4.2.0 (64 bit) - (32 bit) | View release notes |
4.4.1.0 | July 22, 2022 | Download version 4.4.1.0 (64 bit) - (32 bit) | View release notes |
4.4.0.0 | July 15, 2022 | Download version 4.4.0.0 (64 bit) - (32 bit) | View release notes |
4.3.2.0 | Apr 21, 2022 | Download version 4.3.2.0 (64 bit) - (32 bit) | View release notes |
4.3.1.0 | Apr 7, 2022 | Download version 4.3.1.0 (64 bit) - (32 bit) | View release notes |
4.3.0.0 | Feb 21, 2022 | Download version 4.3.0.0 (64 bit) - (32 bit) | View release notes |
4.2.1.0 | Jan 9, 2022 | Download version 4.2.1.0 (64 bit) - (32 bit) | View release notes |
All versions | Follow the link to access full release history | Full release history |
Enhance and monitor system performance, customize favorite settings and more…