CPU Temp - CPU Temperature Monitor for Windows

Latest Version: 1.9.0.0 - Released: 2/4/2026
CPU Temp is a free and simple application for CPU Temperature monitoring, compatible with Windows 11 or earlier versions of Windows OS. CPU Temp seamlessly integrates, giving you real-time insights into your CPU's temperature, utilization, clock speed, power consumption, and other essential parameters of your processor.
With its intuitive and customizable interface, CPU Temp presents a choice of over 40 different UI themes and color palettes. You can choose and select select UI appearance that resonates with your style, ensuring a tailored and immersive monitoring experience.
CPU Temp Application Features
CPU Temp uses a clear and intuitive interface to deliver an easy to use solution for CPU temp check, as well as other important CPU metrics. To the left, users will find a navigation bar split into distinct menu items, each correlating to specific functionalities within the application.
Home view
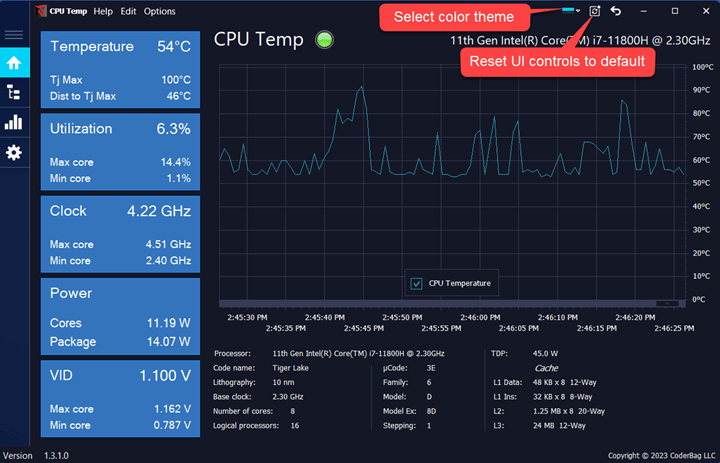
This is the main view of the CPU Temp Monitor application, and has the following items:
- Vertical Tile Items: Located on the left, these tiles provide quick access to various CPU parameters.
- Application Chart: Positioned at the center, chart control provides real-time statistics for the indicator represented by the tile item.
- CPU Information section: Find a summary of important CPU information at the bottom of the home screen
- CPU Thermal Indicator: Conveniently situated next to the application header, this component offers a quick glance at current thermal states for the CPU.
Tile items
By interacting with any tile item (clicking on the tile item), users can alter the application chart to display real-time statistics related to the selected tile indicator (CPU Temperature, CPU Clock, CPU Utilization, CPU Power, CPU Vid).
- CPU Temperature: This tile provides a comprehensive view of temperature metrics, allowing users to:
- View real-time temperature for CPU package.
- Show CPU Tj Max (Junction Maximum), representing the processor's maximum operating temperature
- Show the Distance to Tj Max, which indicates the difference in degrees from the current CPU temperature to Tj Max.
- Note: Temperature metrics can be toggled between Celsius and Fahrenheit through the Edit menu.
- Utilization (Load): This tile displays the percentage of the CPU's capacity presently engaged by running tasks or processes.
- Clock Speed: Indicates the processor's operational frequency. A faster clock speed often implies enhanced performance
- Power: Indicates the CPU's power consumption. The tile can display:
- Power Package: Overall power consumed by the CPU.
- Power Cores: Power utilized by individual processor cores.
- VID: This tile reveals the voltage amount the processor requires (requested by the processor) for its functions. However, it's crucial to differentiate this metric from the actual delivered voltage (vCore).
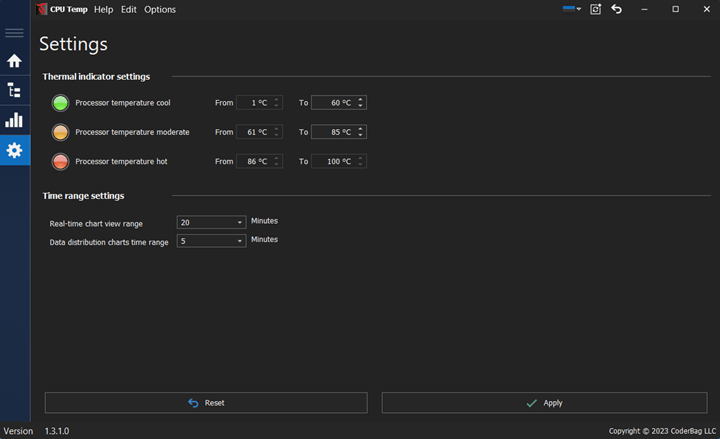
The Processor Thermal Indicator utilizes a three-color scheme to visually represent the current CPU temperature range at which the processor operates. For personalized temperature thresholds, users can navigate to the 'Settings' menu located on the left-hand navigation panel.
- Green: Represents a normal operating CPU temperature, preset to a range of 1-60°C (33-140°F).
- Orange: Indicates a high-load CPU temperature zone, with a default setting spanning 61-85°C (141-185°F).
- Red: Alerts to CPU temperatures approaching critical levels, set by default to range from 85°C (186°F) up to the TjMax limit.
Monitor view
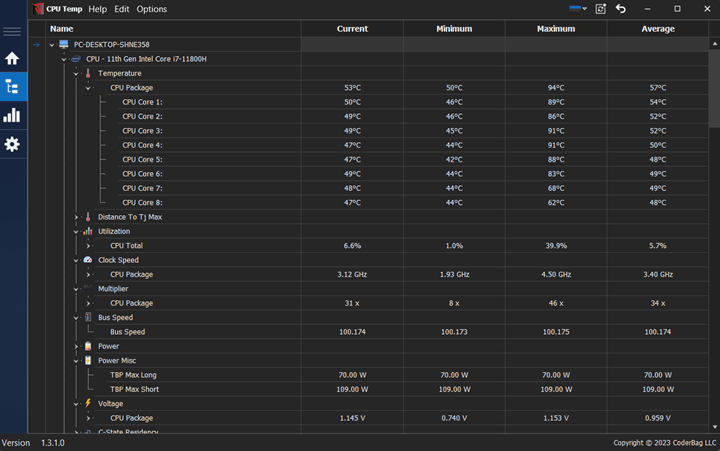
Displays detailed information about the CPU, as well as other hardware sensors such as CPU and GPU temperature, utilization, clock speed, and others. This information provides comprehensive real-time insights into PC hardware data.
Using a toolbar above, you can export a list of hardware sensors and data to various file formats such as:
- CSV
CPU Data Charts view
This control offers a detailed view for CPU data. Depending on your platform, by using the CPU Temp Monoitor you can access up to five distinct chart controls, each tailored to present data aggregation averaged over a configurable time frame defined in minutes.
CPU Data Distribution Charts
- CPU Temperature Distribution: Illustrates the temperature equilibrium for each core (average CPU temp), illustrating how the heat is distributed across all CPU cores.
- CPU Load Distribution: Provides a clear view of the utilization balance across all CPU cores, showing the percentage of each core's active processing capacity.
- CPU Clock Distribution: Displays the consistency of the CPU frequency across all cores.
- CPU Power Distribution: Demonstrates the distribution of power usage among all cores, highlighting energy efficiency and consumption.
Every chart control shows an average distribution data for each CPU core over the configurable time frame window which is set to 5 minutes by default (or less if the application has been running for less than 5 minutes).
Each bar on the chart represents a specific CPU core. The actual time frame window can be configured by going to: Settings -> Data distribution charts time range for charts average data. For example if the time range is set to 3 minutes the application will be calculating average value for each CPU core for the last 3 minutes. Each chart supports hover-over option in order to view details.
Each chart offers a granular view, breaking down average data for individual CPU cores. The timeframe for this display is configurable but is set to 5 minutes by default. Note: that if the application has been active for less than a configured time frame (5 minutes for example), the data will reflect this shorter duration.
What is normal and safe CPU Temperature
Many users wonder what constitutes a good CPU temp, how it is determined, and why maintaining a normal CPU temp is essential.A CPU's temperature is a crucial metric to monitor, as it can affect both performance and processor longevity. The Tj Max (Junction Maximum) temperature is the maximum safe operating temperature specified by the CPU manufacturer. If the temperature of the processor reaches this value, it's considered too hot, and the CPU will typically take measures to protect itself, for instance by reducing performance (throttling), to lower the heat. With this in mind, from the manufacturer's perspective CPU Temperature that is lower than the value of Tj Max (Junction Maximum) is considered safe or operational temperature.
However in order to add more specifics, based on a general belief we can consider several operating ranges in the context of TJ Max value. For this example we’ll assume that CPU Tj Max temp is 100 degrees celsius (212 F).
Normal Operating Range: A CPU typically operates at temperatures between 30°C and 65°C during standard tasks like browsing the web, using applications, or even some light gaming, image processing etc. This range ensures the CPU has enough thermal headroom to handle more intensive tasks without overheating.
High Load Scenarios: Under more demanding tasks, such as gaming, video editing, or other intensive tasks, the CPU temperature can climb higher, often between 70°C and 90°C. While these temperatures are hotter, they're still generally considered safe as long as they don't remain consistently at the upper end for extended time periods.
Approaching Tj Max: When the CPU temperature starts approaching the TjMax (in this case, 100°C), it's a cause for concern. Consistently operating near or at Tj Max can reduce the lifespan of the CPU and may result in performance degradation due to thermal throttling.
Exceeding Tj Max: Should a CPU exceed its Tj Max, even briefly, it has built-in protection mechanisms to prevent damage. The CPU will either throttle its performance significantly or shut down to protect itself from damage. This is not a desired operating state and indicates a potential issue with the cooling solution or other factors in the system.
For the average end-user, it's always best to monitor CPU temperatures, especially if they're running demanding applications or gaming. If temperatures regularly approach the TjMax value, it might be time to look into improving the system's cooling, ensuring vents and fans are dust-free, or even considering reapplying thermal paste between the CPU and its cooler. Another factor that can significantly affect thermal ranges is overclocking. In general, regularly exceeding the safe temperature range can degrade system performance.
What happens when CPU Temperature is too high
When a CPU's temperature rises beyond its optimal operating range, the built-in protection mechanism known as "throttling" activates. Throttling reduces the CPU's clock frequency, voltage or other parameters to lower its power consumption and heat output. This ensures the processor remains within safe thermal limits, preventing potential damage.
However, this protective measure can lead to decreased system performance, as the CPU cannot work at its peak capability while throttling is in effect. Monitoring CPU temperatures and addressing the root causes of overheating can help avoid consistent throttling and maintain optimal system performance.
In addition CPUs come with advanced thermal sensors placed within the chip. These sensors help in monitoring the temperatures of various components like CPU cores, or graphics. If a specific part of the CPU gets too hot, targeted throttling mechanisms can be applied to ensure overall system stability while optimizing performance.
CPU Throttling and performance limits
CPU Core Clock Throttling: Under thermal stress, CPU cores may reduce their operating frequency. This directly affects compute-intensive tasks, as the raw processing speed drops to mitigate heat generation.
iGPU throttling: When the iGPU thermal thresholds are breached, its clock frequency can decrease. This manifests as decreased graphics performance, noticeable in tasks like gaming or real-time rendering.
iCCMax Throttling (Current Limit Throttling): iCCMax value indicates the maximum current that a particular CPU component (like a core or the integrated graphics) is allowed to draw throughout the voltage rail. When a CPU component starts drawing current close to or exceeding its default/save IccMax value, the processor will initiate throttling mechanisms to reduce the amount of amperage that a particular CPU component is allowed to draw throughout the voltage rail.
Turbo Limits and Ratios: Turbo boost often directly impacts the main cores, allowing them to achieve higher clock speeds temporarily. Overheating can limit these boosts, making the system to lower performance
RAPL Performance limit PL-1, PL-2 (Running Average Power Limit) RAPL is a mechanism introduced by Intel to monitor and set power limits on the CPU. Where PL1 is a long term power limit of the CPU and PL2 specifies a short term power limit of a CPU. When the CPU detects that its drawing power is close to or exceeding the PL1 or PL2 limits, it will throttle its performance to stay within those boundaries. This might involve reducing clock speeds or voltages to manage power consumption.
Bd Prochot (Bidirectional Processor Hot): This is an external signal mechanism allowing components to communicate thermal distress. If an external component, e.g. the CPU Core/s experiences excessive temperatures, it can send a Bd Prochot signal to instruct the CPU to throttle. This preemptive measure ensures holistic system stability by reducing overall thermal output, even if the CPU itself isn't overheating
TDP Throttling (Thermal Design Power Throttling): Every CPU has a specified Thermal Design Power (TDP) indicating its maximum heat generation under typical loads. If the CPU's heat production exceeds the TDP, it will throttle its performance to stay within specified limits. Such throttling ensures the CPU operates within safe thermal envelopes, although it can limit peak performance.
Voltage Reduction: Voltage plays a pivotal role in CPU operations and its thermal profile. By modulating the supplied voltage, the CPU can manage its energy consumption and consequent heat production. Though an effective cooling strategy, significant voltage reductions can affect CPU stability and performance.
Why is my CPU temperature so high
Overclocking: Pushing your CPU to run at frequencies higher than its default turbo frequencies, will generate extra heat. Overclocking increases voltage and clock speeds, stressing the CPU and raising its thermal footprint.
Inadequate Thermal Solution: Not all cooling solutions are created equal. Using a stock cooler or an outdated thermal solution might not dissipate heat effectively, especially under heavy loads.
Bad Airflow: A cramped or poorly designed case can restrict airflow. Without sufficient airflow, hot air gets trapped, causing components, including the CPU, to heat up.
Aged/Bad quality Thermal Paste: Thermal paste acts as a conduit, transferring heat from the CPU surface to the cooler heatsink and heat pipes. Over time, thermal paste can degrade or dry out, reducing its effectiveness in transferring heat.
High Ambient Temperatures: The environment matters. If the room or cabinet housing the computer is hot, the system has a higher baseline temperature, causing components to heat up more rapidly. This is especially true with air/fan based coolers.
Intensive Workloads: Some tasks push the CPU harder. Running compute-intensive applications or multitasking heavily can keep the CPU constantly active, producing more heat.
Dusty Environment Dust can be a silent thermal killer. Dust accumulation can clog fans and air vents, hampering airflow and acting as insulation, trapping heat.
Malfunctioning Fans: Sometimes, the cooling fails. Fans that don't spin at the correct RPM or have stopped working entirely can't dissipate heat effectively.
Voltage Issues: Incorrect voltage settings can be problematic. Supplying too much voltage to the CPU, either due to manual adjustments or motherboard misconfigurations, can raise temperatures.
How to check CPU Temperature on Window 10/11
Monitoring your CPU's temperature on Windows is straightforward. Follow these steps:
- Download and install the CPU Temp monitor. (See the download link provided below.)
- Launch the CPU Temp application. By default, the program will display the "CPU Temperature" tile, alongside a temperature chart. If you'd like to view different data, simply click on tiles like "CPU Temperature," "Utilization," "Clock," etc. This action will switch the display to graphs representing specific sensor parameters.
- The data presented in the CPU Temp application may vary depending on your CPU. Typically, you can expect to see:
- CPU package temperature.
- TJ Max temperature for CPU.
- Distance to TJ Max temperature for CPU
- Temperature for each individual CPU core.
- Distance to Tj Max for each core.
- A bar chart illustrating the CPU temperature distribution across cores.
- CPU Thermal state indicator
Package
Installer x32/64:CPUTempSetup-1.8.0.0
Current version 1.9.0.0
Release date: 2/4/2026
Compiled for: .NET 4.7.2
Tested on platforms: Win7 x64-en SP 1, Win10 x64-en, Win11 x64-en
Send your suggestions to: [email protected]
CPU Temp - Release history
| Release version | Release date | Download | Release notes |
|---|---|---|---|
| 1.9.0.0 | Feb 4, 2026 | Download version 1.9.0.0 | View release notes |
| 1.8.0.0 | Sept 5, 2025 | Download version 1.8.0.0 | View release notes |
| 1.7.1.0 | Apr 11, 2025 | Download version 1.7.1.0 | View release notes |
| 1.7.0.0 | Feb 25, 2025 | Download version 1.7.0.0 | View release notes |
| 1.6.2.0 | Mar 17, 2024 | Download version 1.6.2.0 | View release notes |
| 1.6.1.0 | Mar 8, 2024 | Download version 1.6.1.0 | View release notes |
| 1.6.0.0 | Mar 1, 2024 | Download version 1.6.0.0 | View release notes |
| 1.5.0.0 | Feb 23, 2024 | Download version 1.5.0.0 | View release notes |
| 1.4.0.0 | Nov 24, 2023 | Download version 1.4.0.0 | View release notes |
| 1.3.1.0 | Nov 14, 2023 | Download version 1.3.1.0 | View release notes |
| 1.2.0.0 | Nov 3, 2023 | Download version 1.2.0.0 | Initial release |
About Our Software
Enhance and monitor system performance, customize favorite settings and more…


