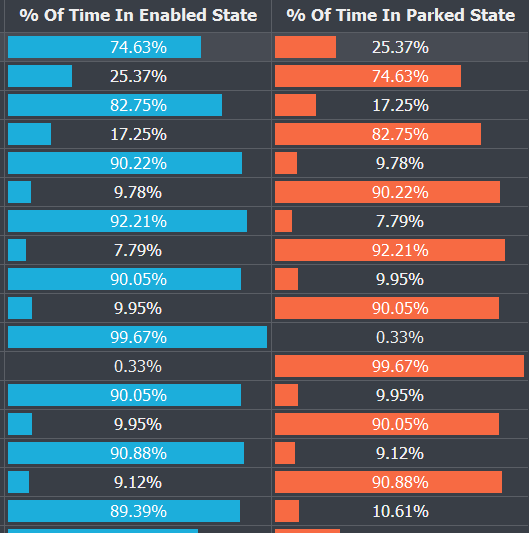
CPU Core Parking
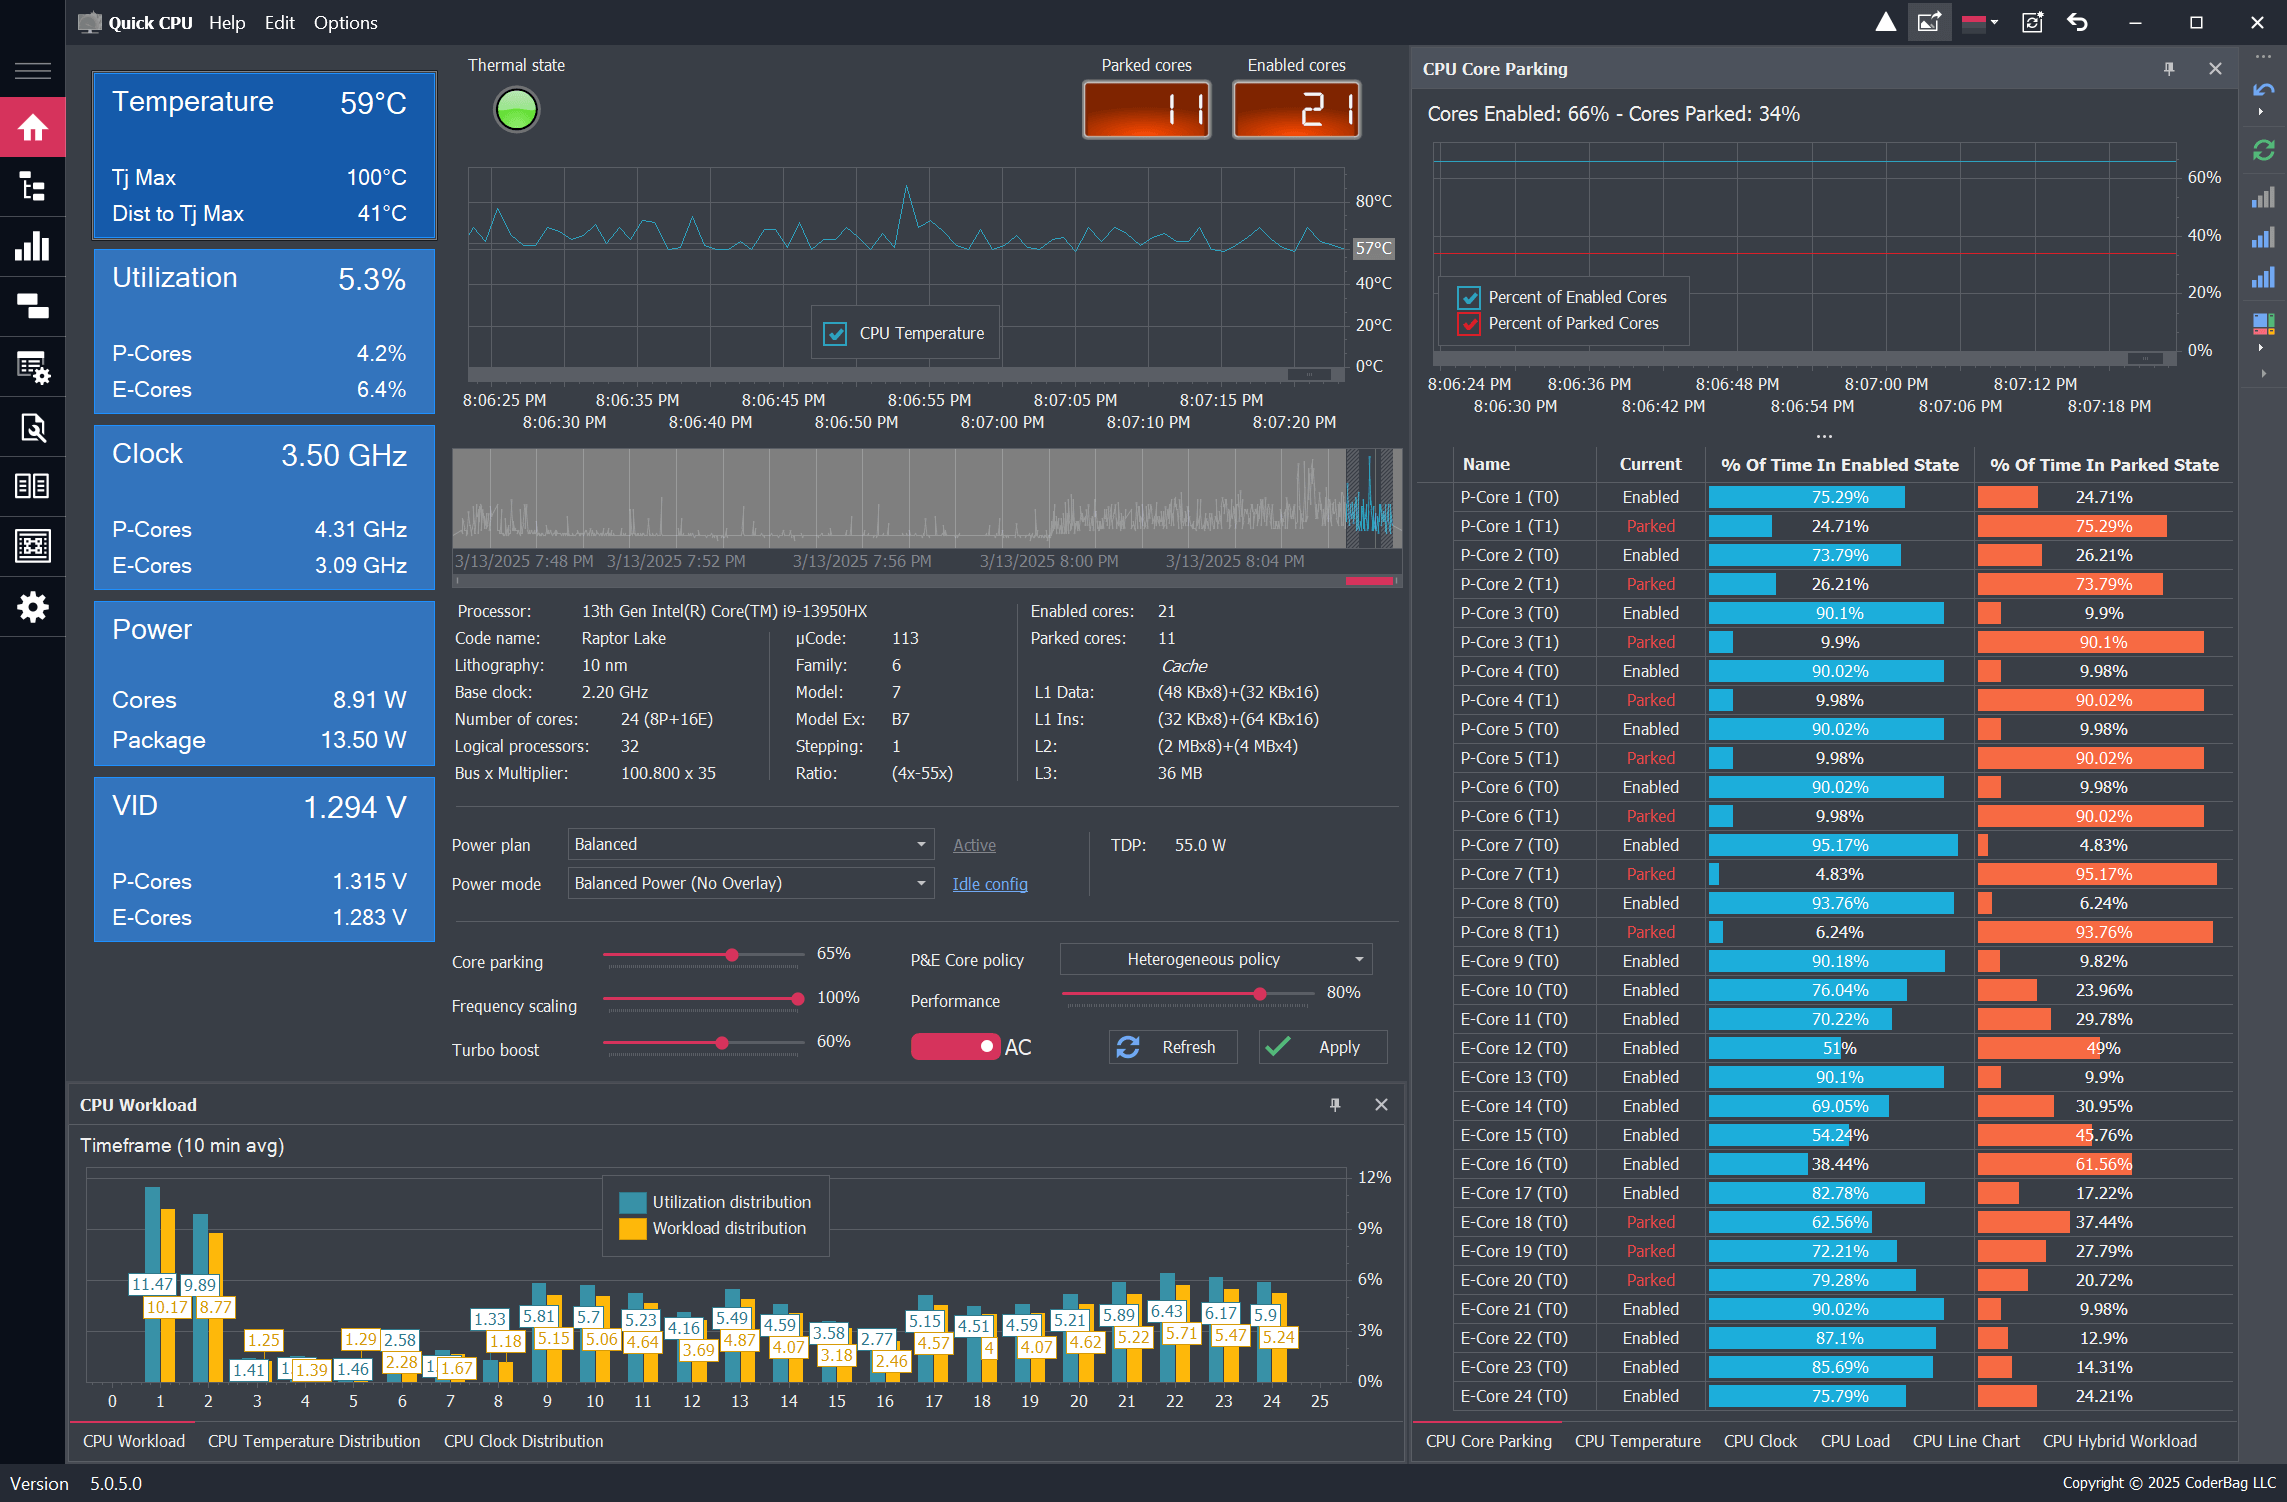
Control how Windows parks CPU cores based on system load. Optimize power usage or unlock full core performance depending on your needs. Read more
Performance Optimization, System Monitoring & Stability Testing
Latest Version: 6.5.0.0 - Released: 5/15/2026
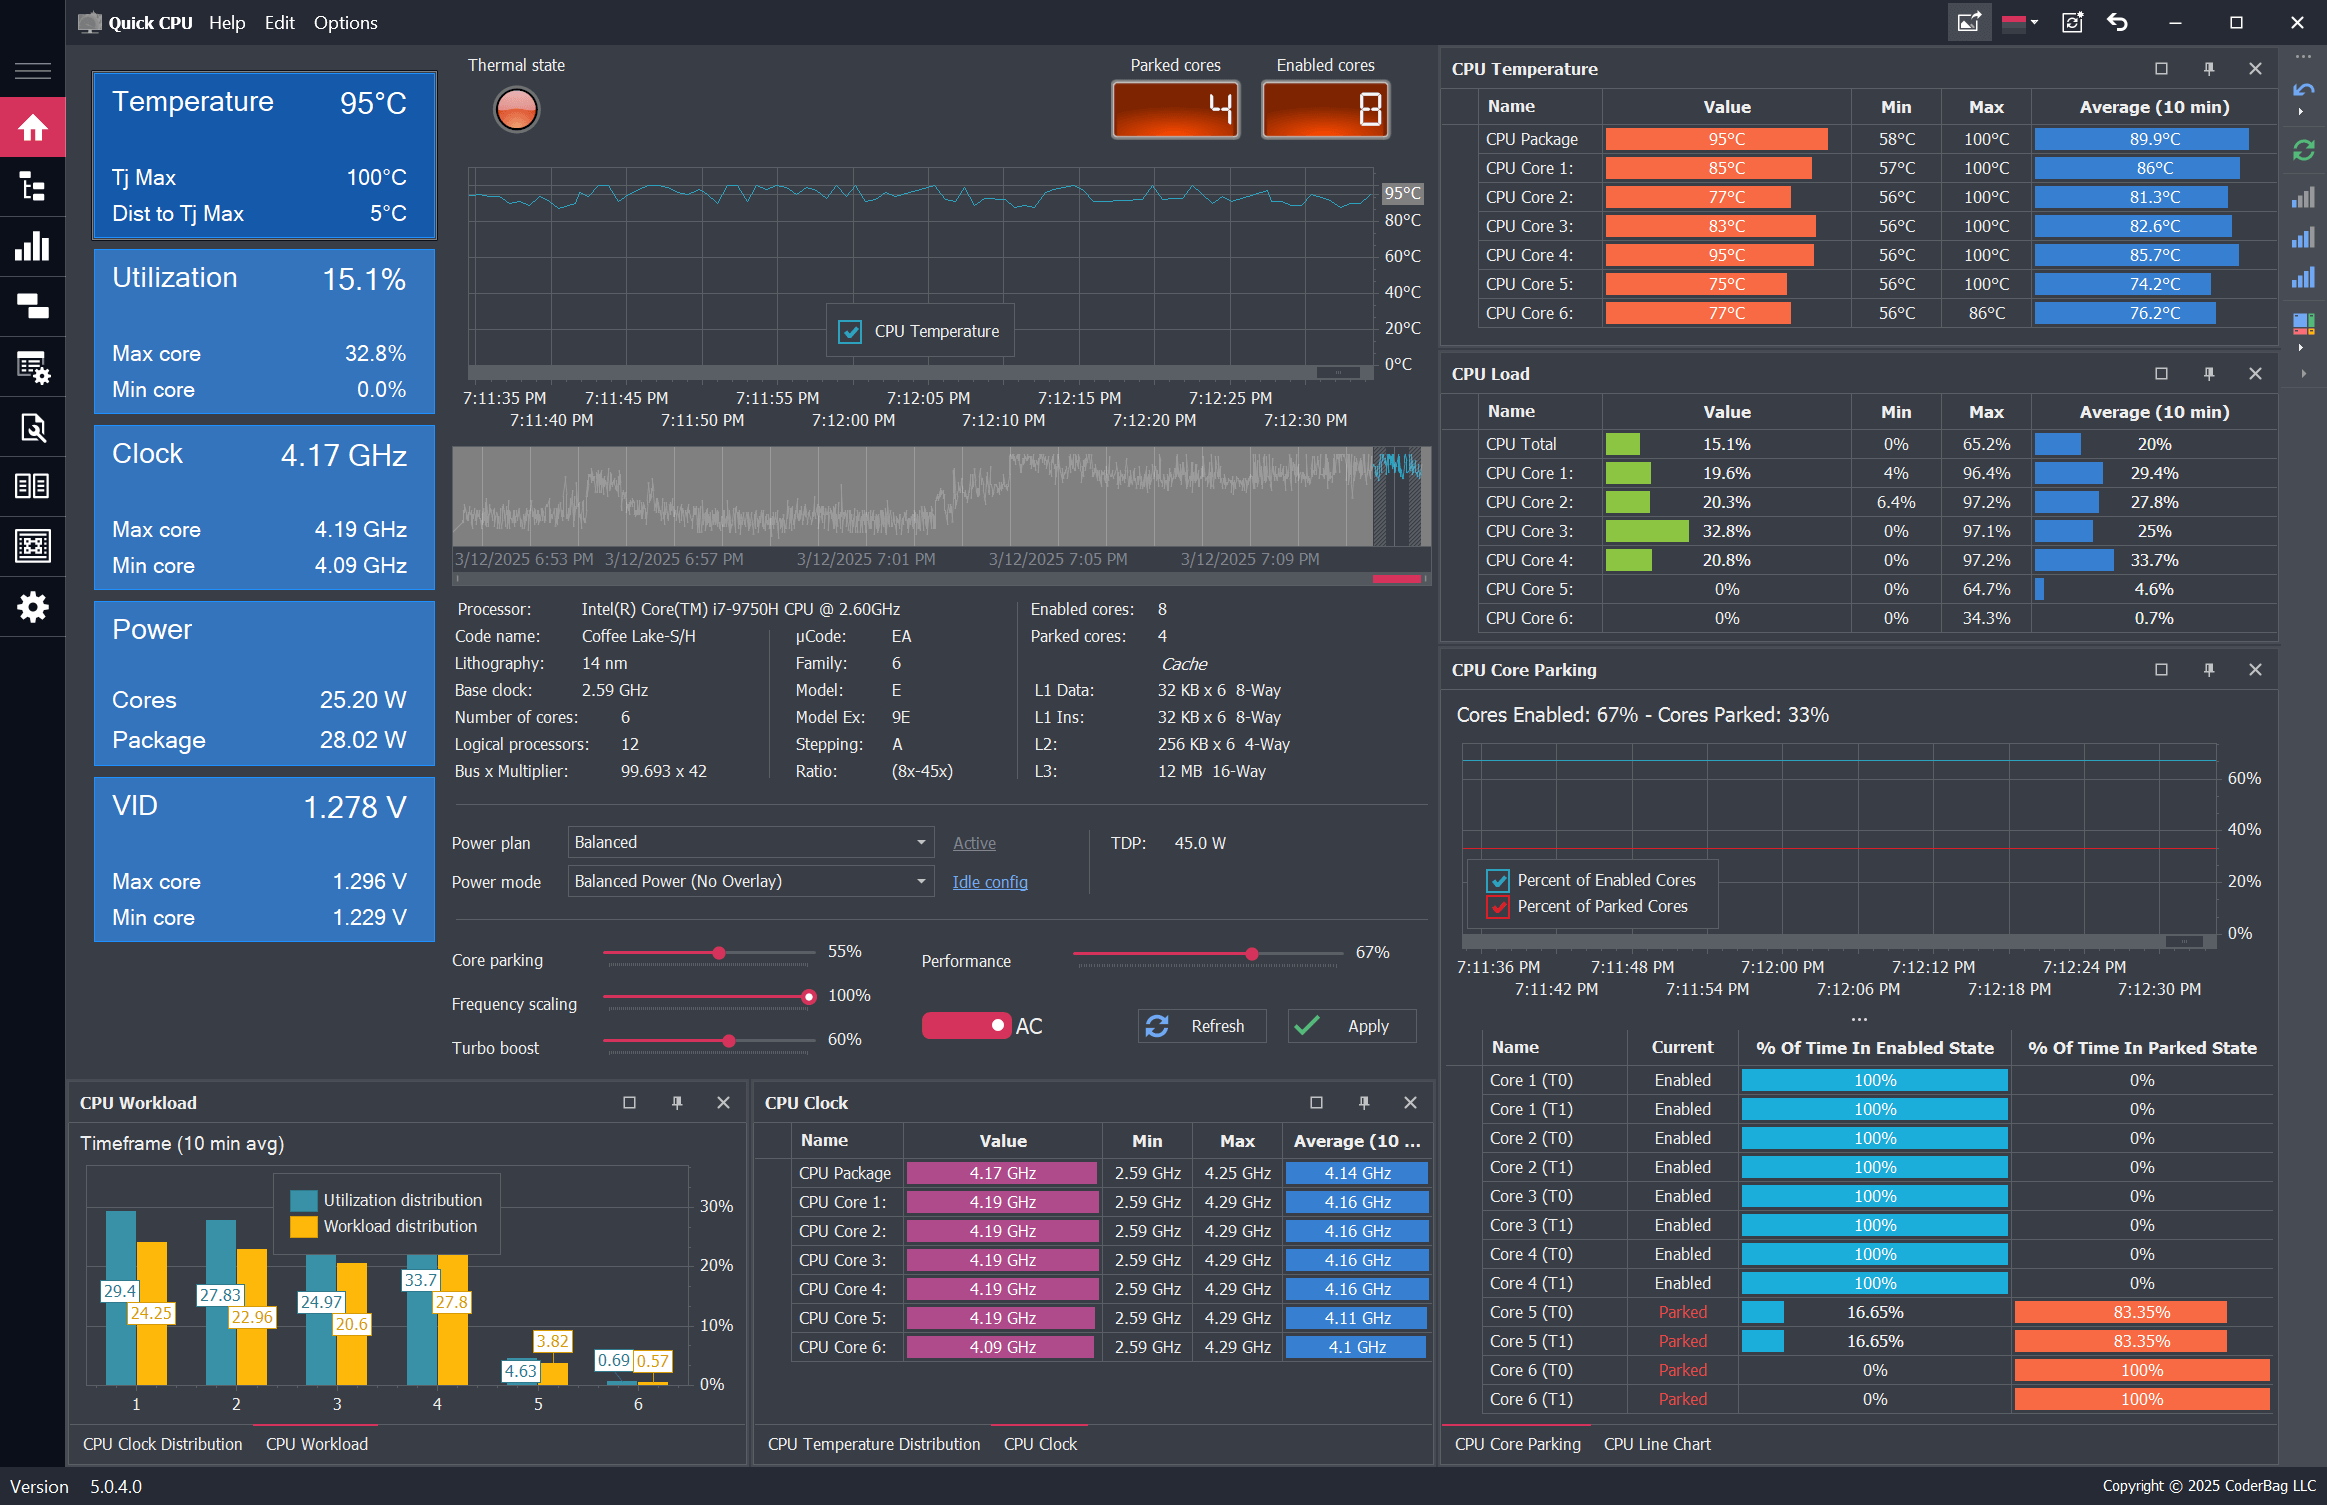
Quick CPU is a powerful CPU monitoring, performance tuning, and stability testing application designed for both Intel® and AMD® processors. It provides real-time visibility and control over key system parameters such as CPU temperature, power, voltage, frequency, core usage, core parking, performance, voltage, current, and power management features.
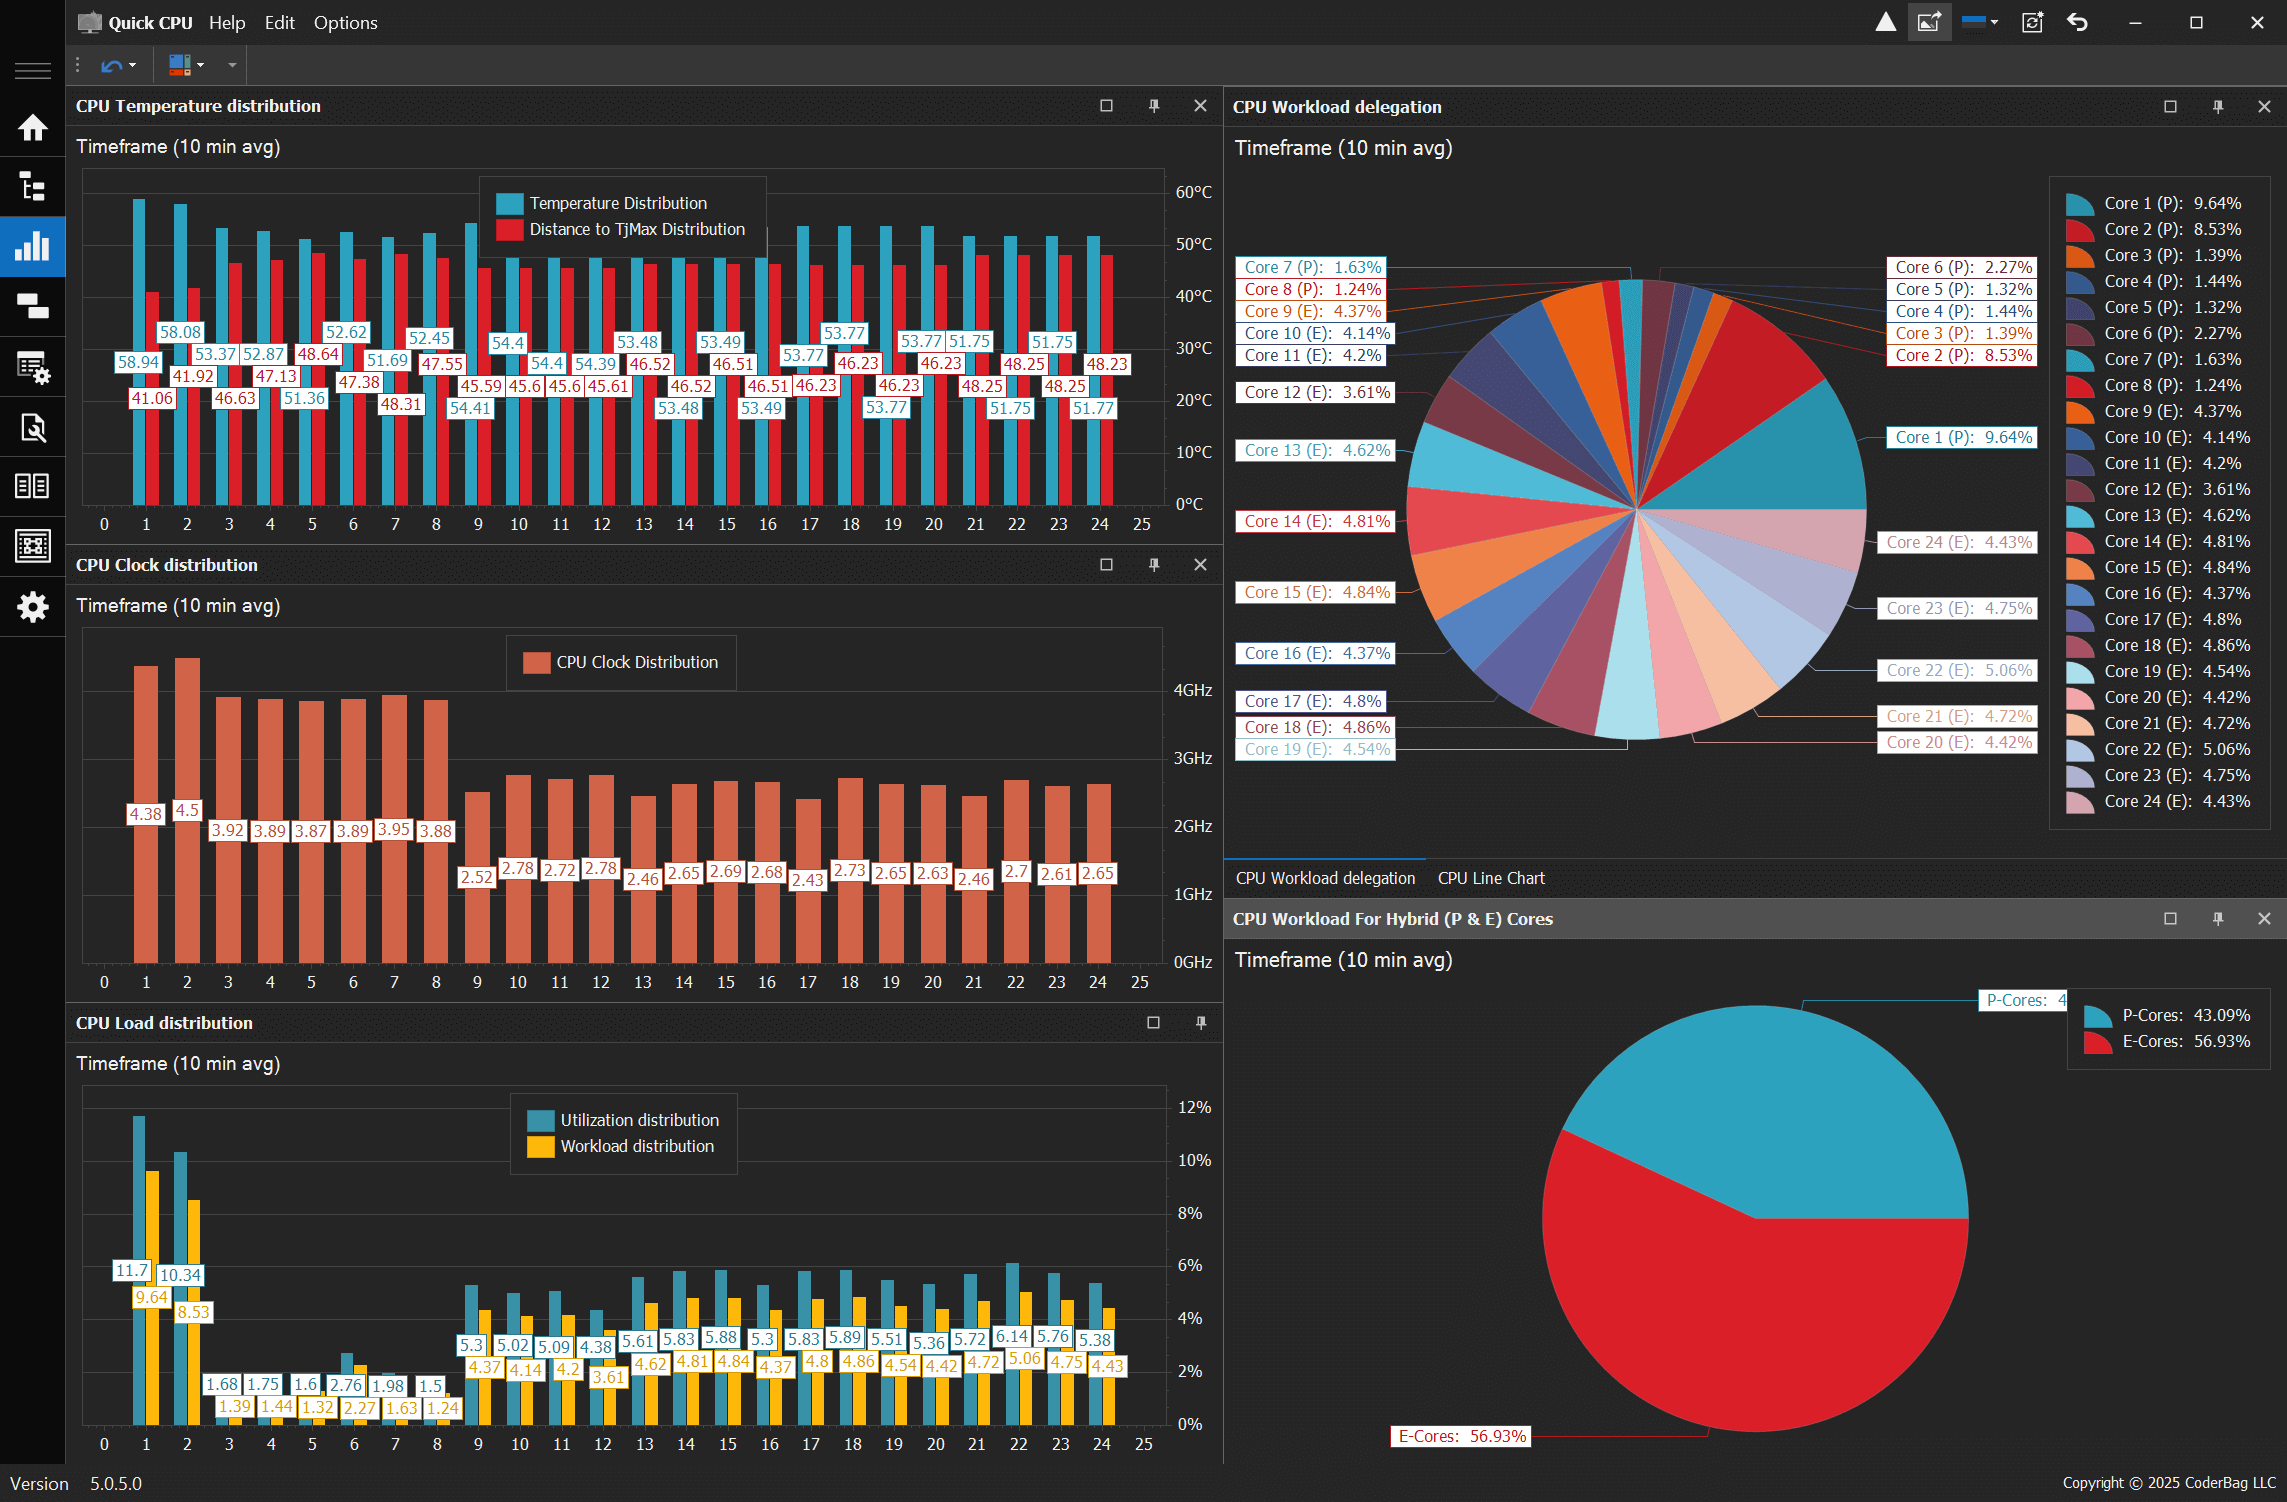
The application also includes customizable power plan controls, turbo power limit configuration, core performance ratios, and detailed charts for analyzing workload, thermal distribution, and frequency scaling across all CPU cores. Quick CPU 6.0.0 introduces a dedicated CPU stress and stability test module for validating system stability under various load conditions, with support for per-core/thread load selection and multiple CPU test types. While certain advanced CPU settings (such as Speed Shift and FIVR control) are currently available for Intel CPUs, Quick CPU offers comprehensive functionality for all users looking to optimize performance, improve power efficiency, and validate system reliability.
Explore powerful tools to fine-tune CPU performance, manage energy consumption, and take control of your system.
Control how Windows parks CPU cores based on system load. Optimize power usage or unlock full core performance depending on your needs. Read more
Place the processor under a controlled, high-load environment to evaluate system stability, cooling efficiency, and performance behavior. Read more
Manage Intel Turbo Boost and AMD Precision Boost settings to ensure maximum performance when it matters most. Read more
Fine-tune how your CPU prioritizes performance over energy savings using built-in Windows performance hints and power overlays. Read more
Access low-level tuning for Intel CPUs, including Fully Integrated Voltage Regulator (FIVR), Turbo Power Limits, Speed Shift and other power, performance or voltage controls. Read more
Made changes you're unsure about? Quickly revert power plans or CPU settings to system defaults or previous backups. Read more
Use heterogeneous scheduling policies to restrict or prioritize P-Cores or E-Cores on Intel hybrid architecture CPUs. Read more
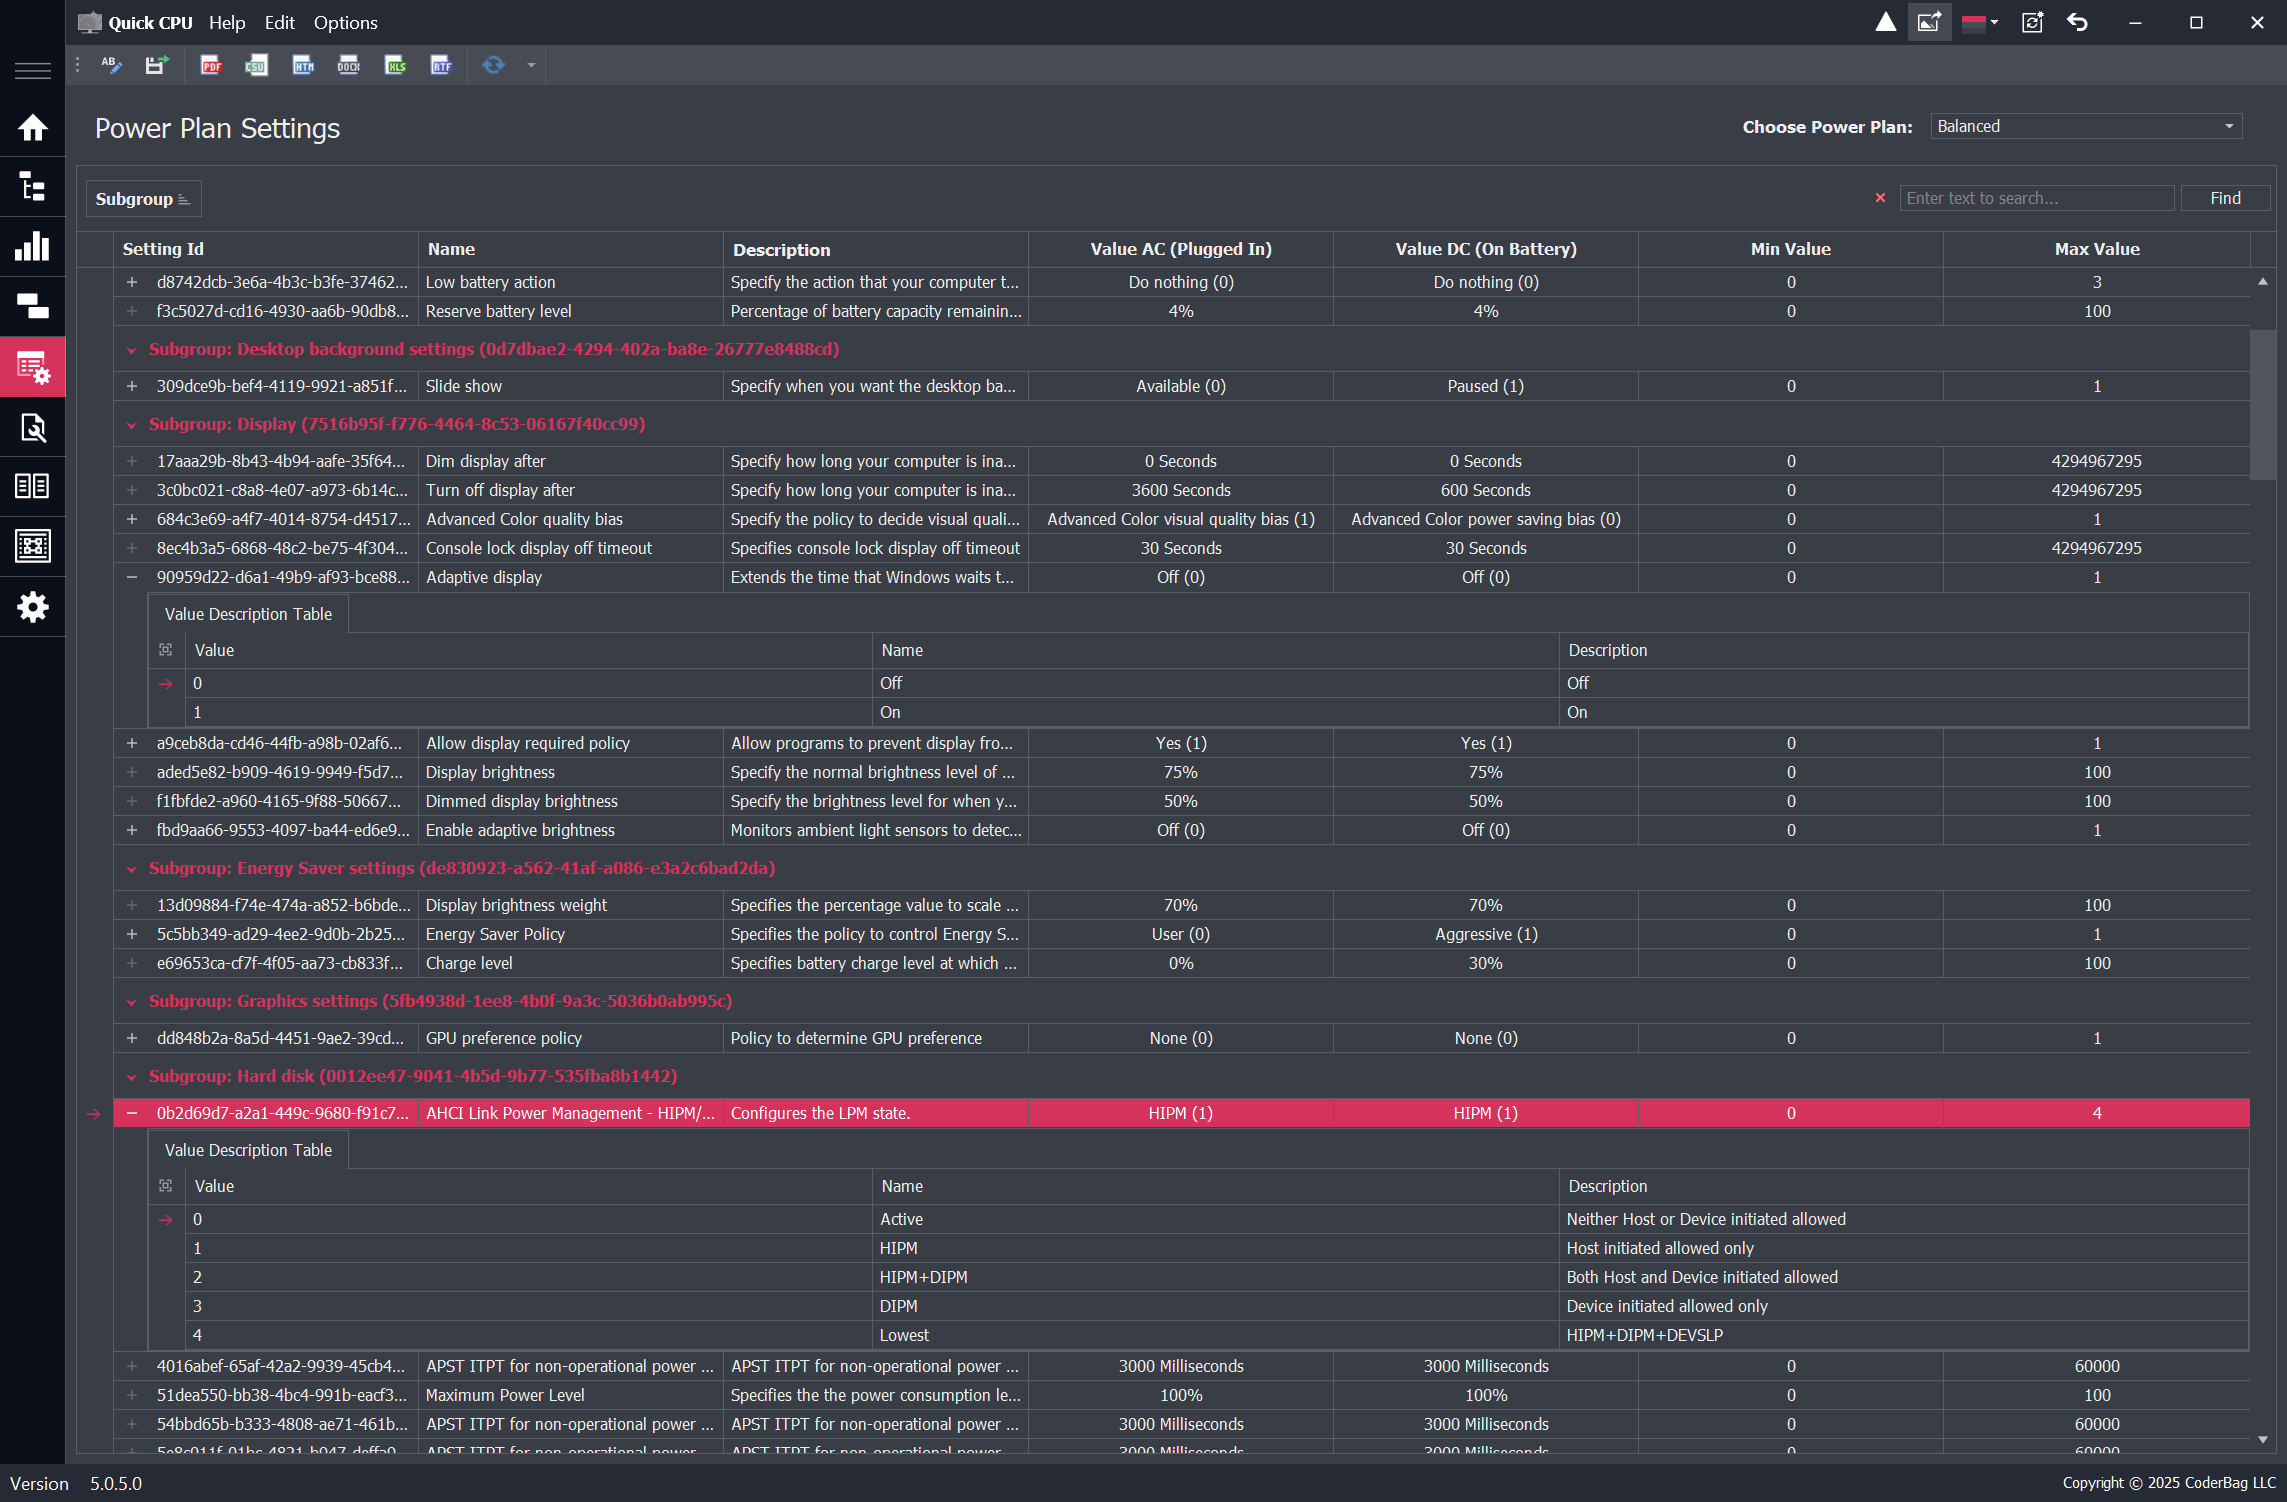
Create, activate, clone, or export custom power plans and restore system defaults. Fine-tune how Windows balances performance and energy usage. Read more
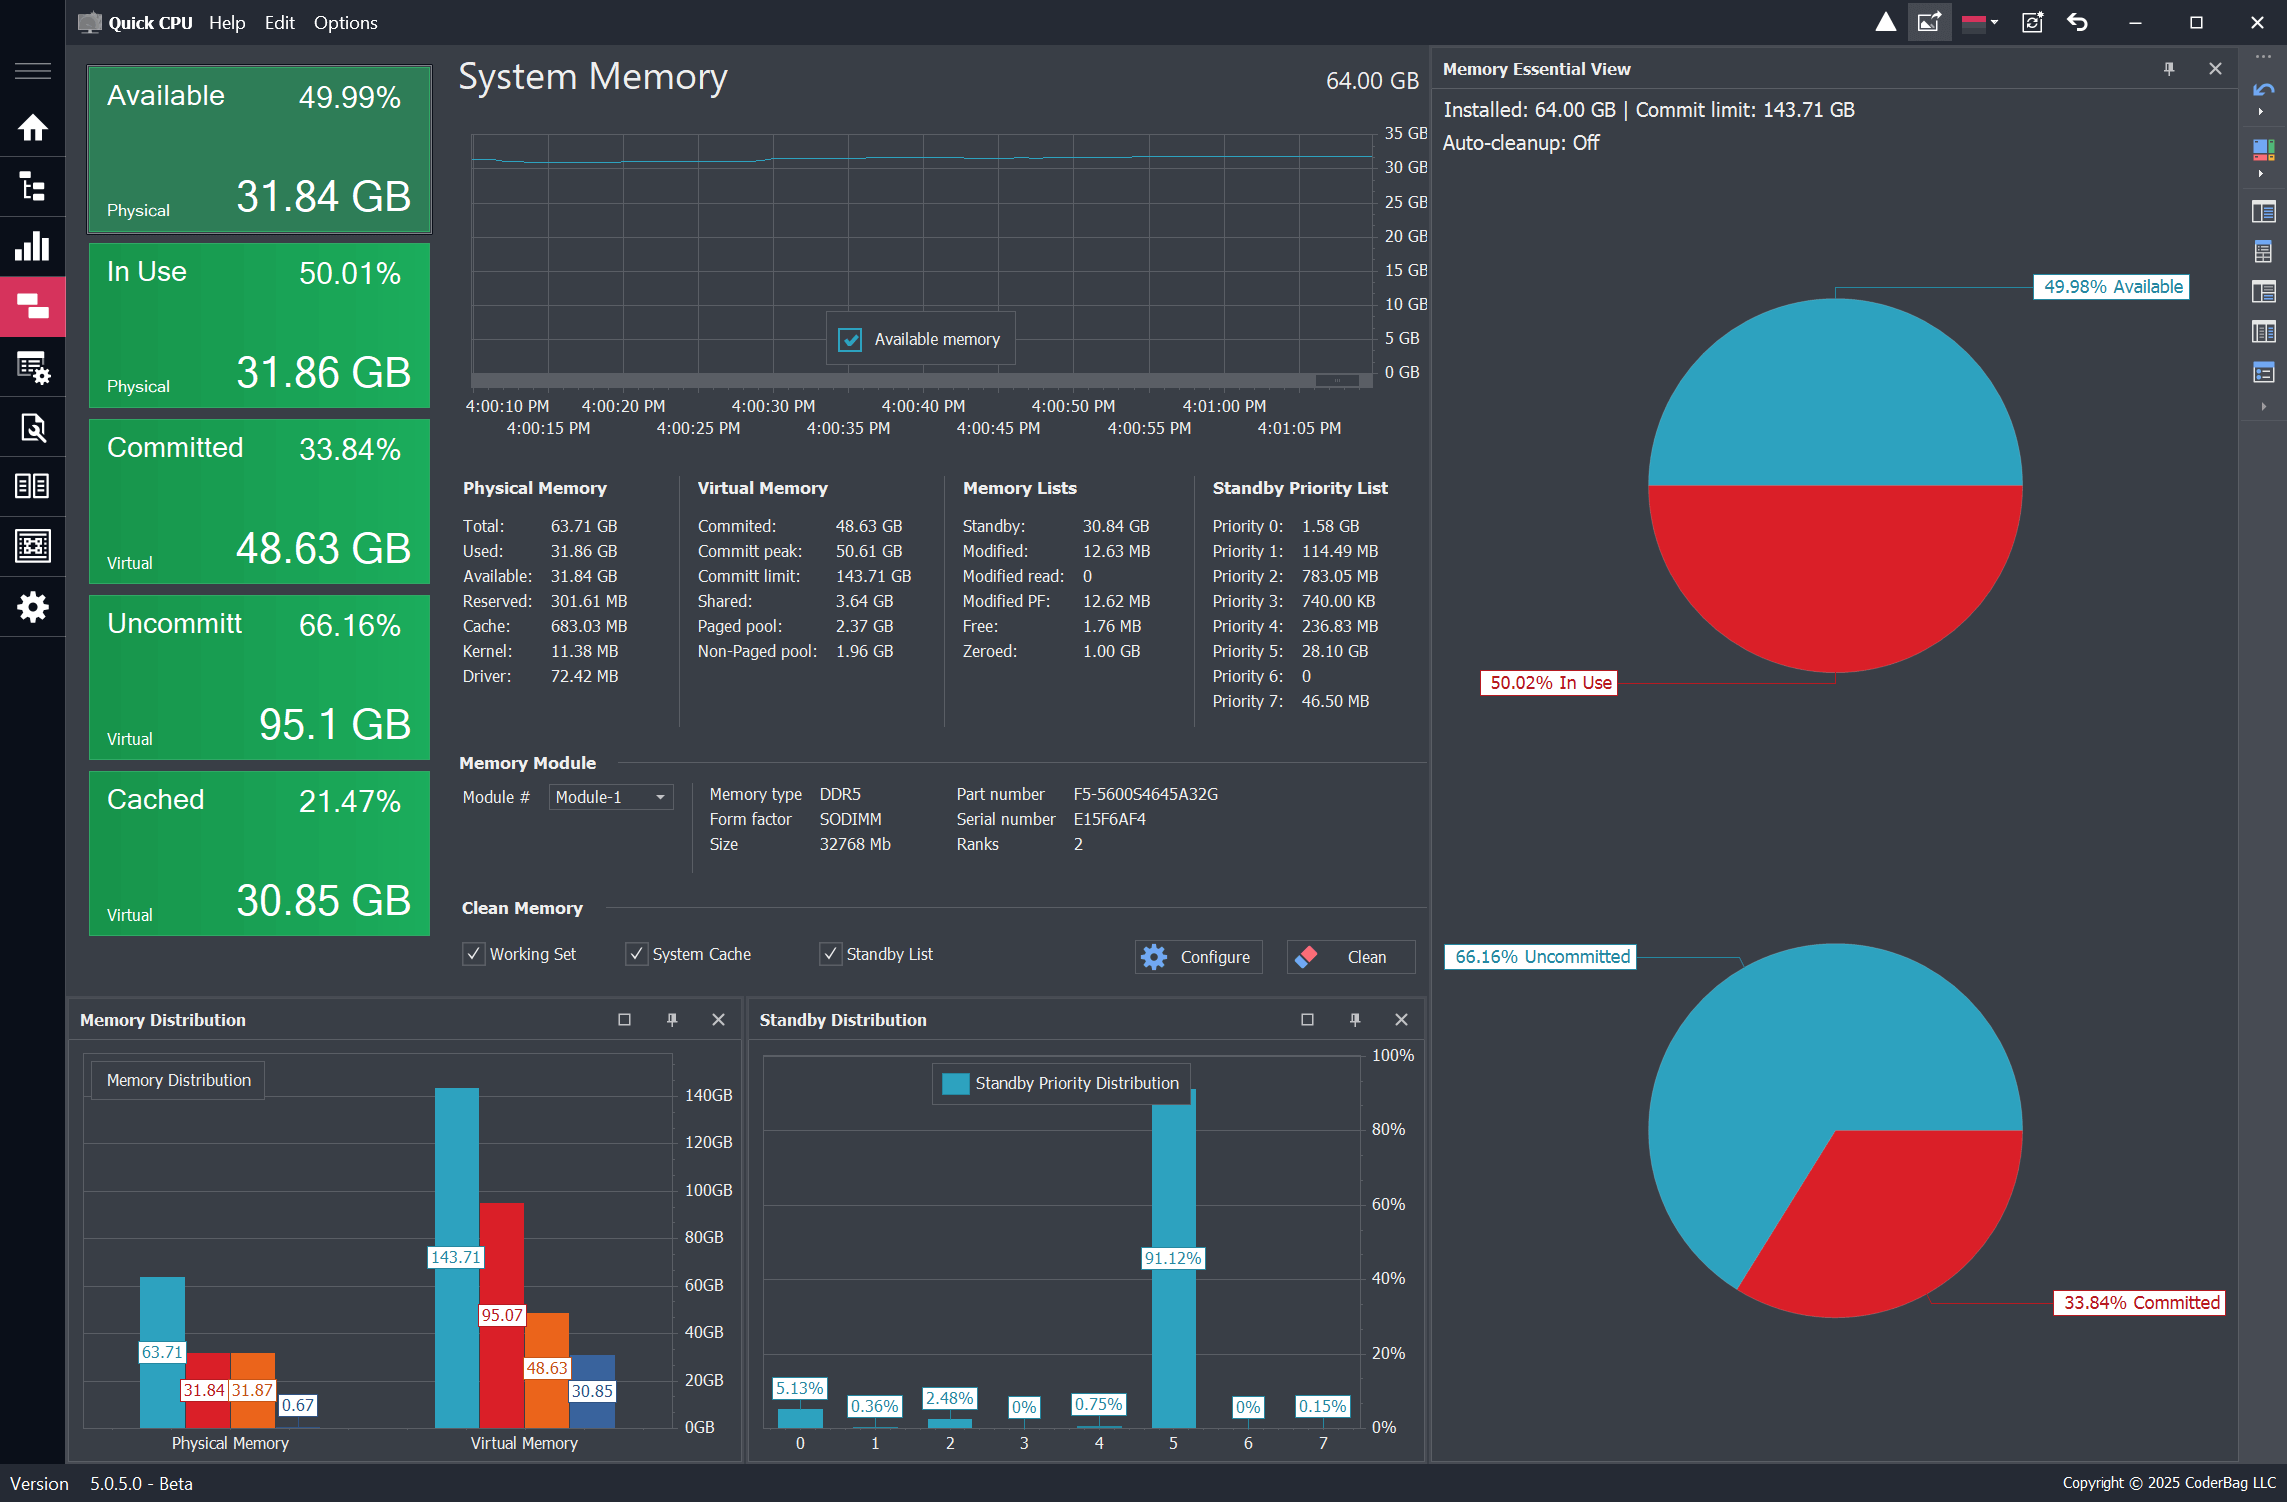
Monitor CPU, memory, and GPU activity in real time from the system tray. Customize display options and interaction behavior for instant access. Read more
Learn more about the Quick CPU functionality and specific features by visiting the application documentation page. Read more
Your system, your way. Quick CPU offers a clean and intuitive interface that can be tailored to your preferences. Switch between light and dark modes, customize performance graphs, and configure dashboard elements for an optimal user experience. View details
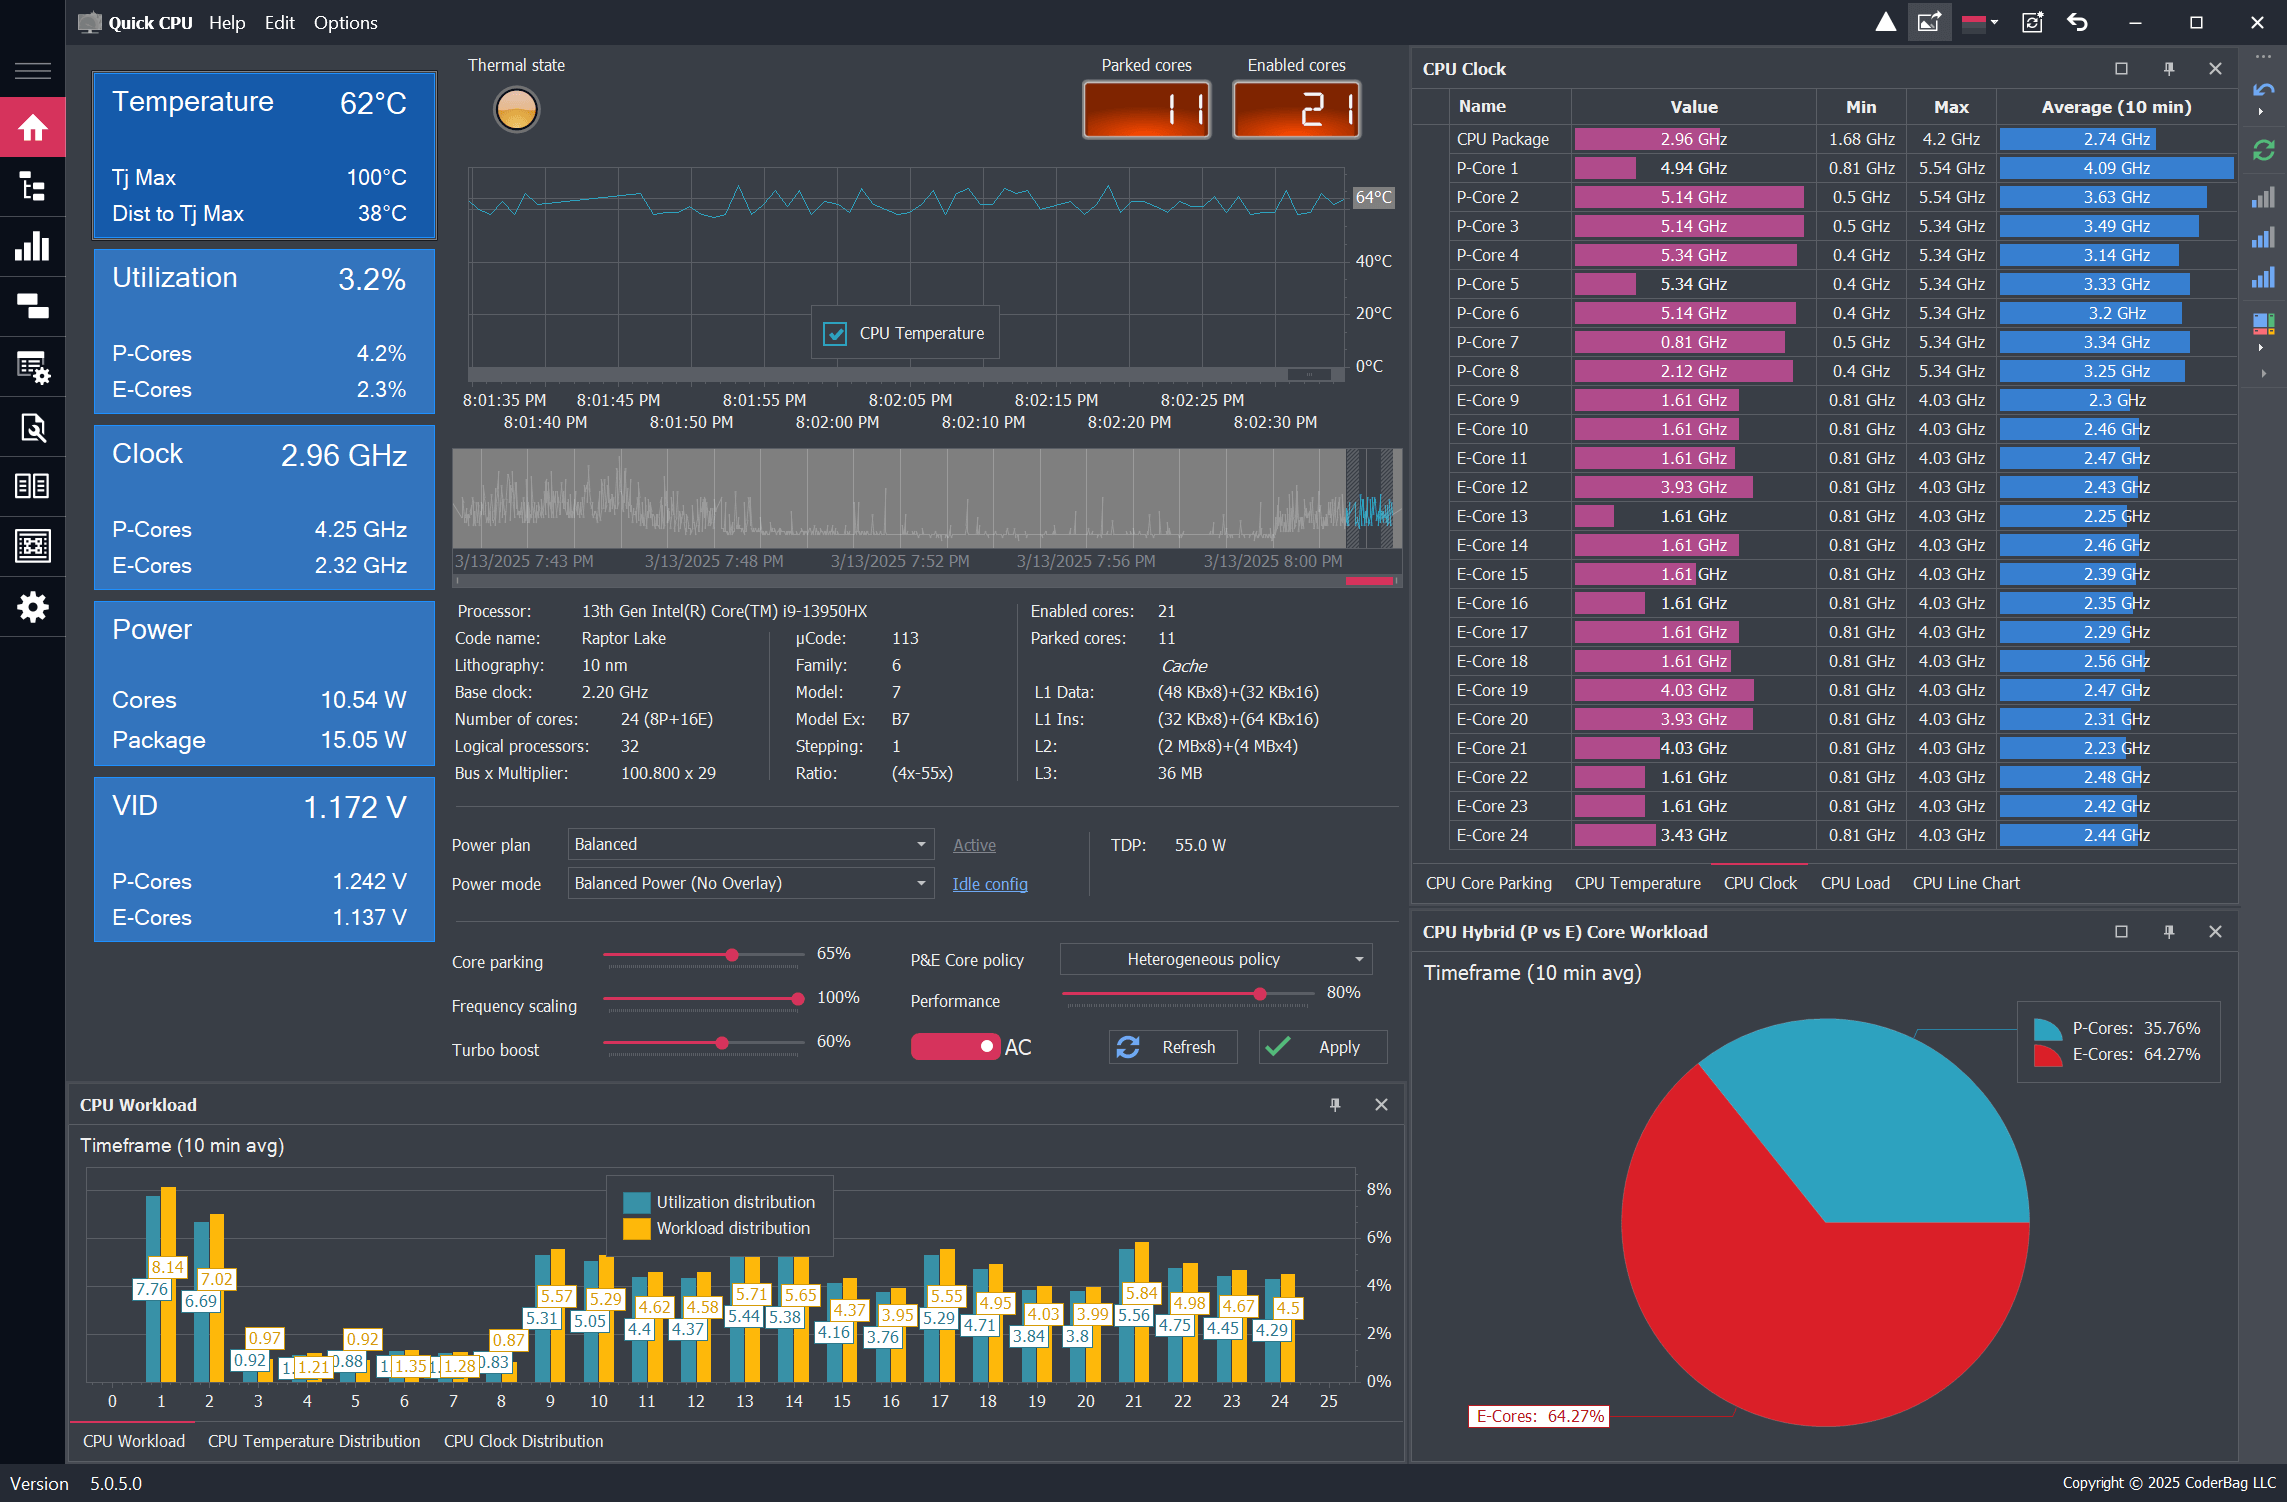
Quick CPU allows you to make adjustments on the fly. Whether you need to increase processing power for demanding tasks or scale down for energy savings, Quick CPU ensures seamless real-time tuning without the need for a restart. View details
Take full control over your system’s power behavior with advanced power plan customization. Quick CPU allows you to fine-tune CPU performance states, adjust power limits, and optimize efficiency for laptops. Whether you're maximizing performance for heavy workloads or extending battery life, our tools give you the flexibility to tailor your system to your needs. View details
Version: 6.5.0.0
Release Date: May 15, 2026
Target Framework: .NET Framework 4.7.2
Tested On: Windows 10 (x64, en), Windows 11 (x64, en)
Prerequisite: .NET Framework 4.7.2 or later must be installed on your system.
Take full control of your CPU’s power and efficiency. Adjust core parking, frequency scaling, and performance to fine-tune your system. Whether you're a gamer or a power user, Quick CPU helps you optimize your system to suit your needs.
Validate system stability with Quick CPU’s advanced stress-testing module. Run controlled CPU load tests across individual cores or threads, evaluate thermal behavior, verify power delivery, and detect potential reliability issues before they affect performance.
Quick CPU comes with online documentation to help you get the most out of every feature. Whether you're just getting started or exploring advanced tuning options, our user guides, feature explanations, and tooltips are designed to support users of all levels
| Release version | Release date | Download | Release notes |
|---|---|---|---|
| 6.5.0.0 | May 15, 2026 | Download version 6.5.0.0 | View release notes |
| 6.4.1.0 | Apr 14, 2026 | Download version 6.4.1.0 | View release notes |
| 6.4.0.0 | Apr 8, 2026 | Download version 6.4.0.0 | View release notes |
| 6.3.0.0 | Mar 5, 2026 | Download version 6.3.0.0 | View release notes |
| 6.2.1.0 | Feb 4, 2026 | Download version 6.2.1.0 | View release notes |
| 6.1.0.0 | Dec 23, 2025 | Download version 6.1.0.0 | View release notes |
| 6.0.0.0 | Nov 25, 2025 | Download version 6.0.0.0 | View release notes |
| 5.3.0.0 | Oct 16, 2025 | Download version 5.3.0.0 | View release notes |
| 5.2.0.0 | Sept 5, 2025 | Download version 5.2.0.0 | View release notes |
| 5.1.0.0 | June 17, 2025 | Download version 5.1.0.0 | View release notes |
| 5.0.9.0 | Apr 11, 2025 | Download version 5.0.9.0 | View release notes |
| 4.11.0.0 | Nov 14, 2024 | Download version 4.11.0.0 (64 bit) - (32 bit) | View release notes |
| Earlier versions | Follow the link to access release history | Release history |
Enhance and monitor system performance, customize favorite settings and more…